
By now, you’re probably familiar with all the buzz around PromCon. But if you missed our Day 1 highlights —you can catch up on everything there.
Now, let’s discuss key takeaways, ideas, and highlights from Day 2 of PromCon 2024!
Inside a PromQL Query: Understanding the Mechanics – Bryan Boreham
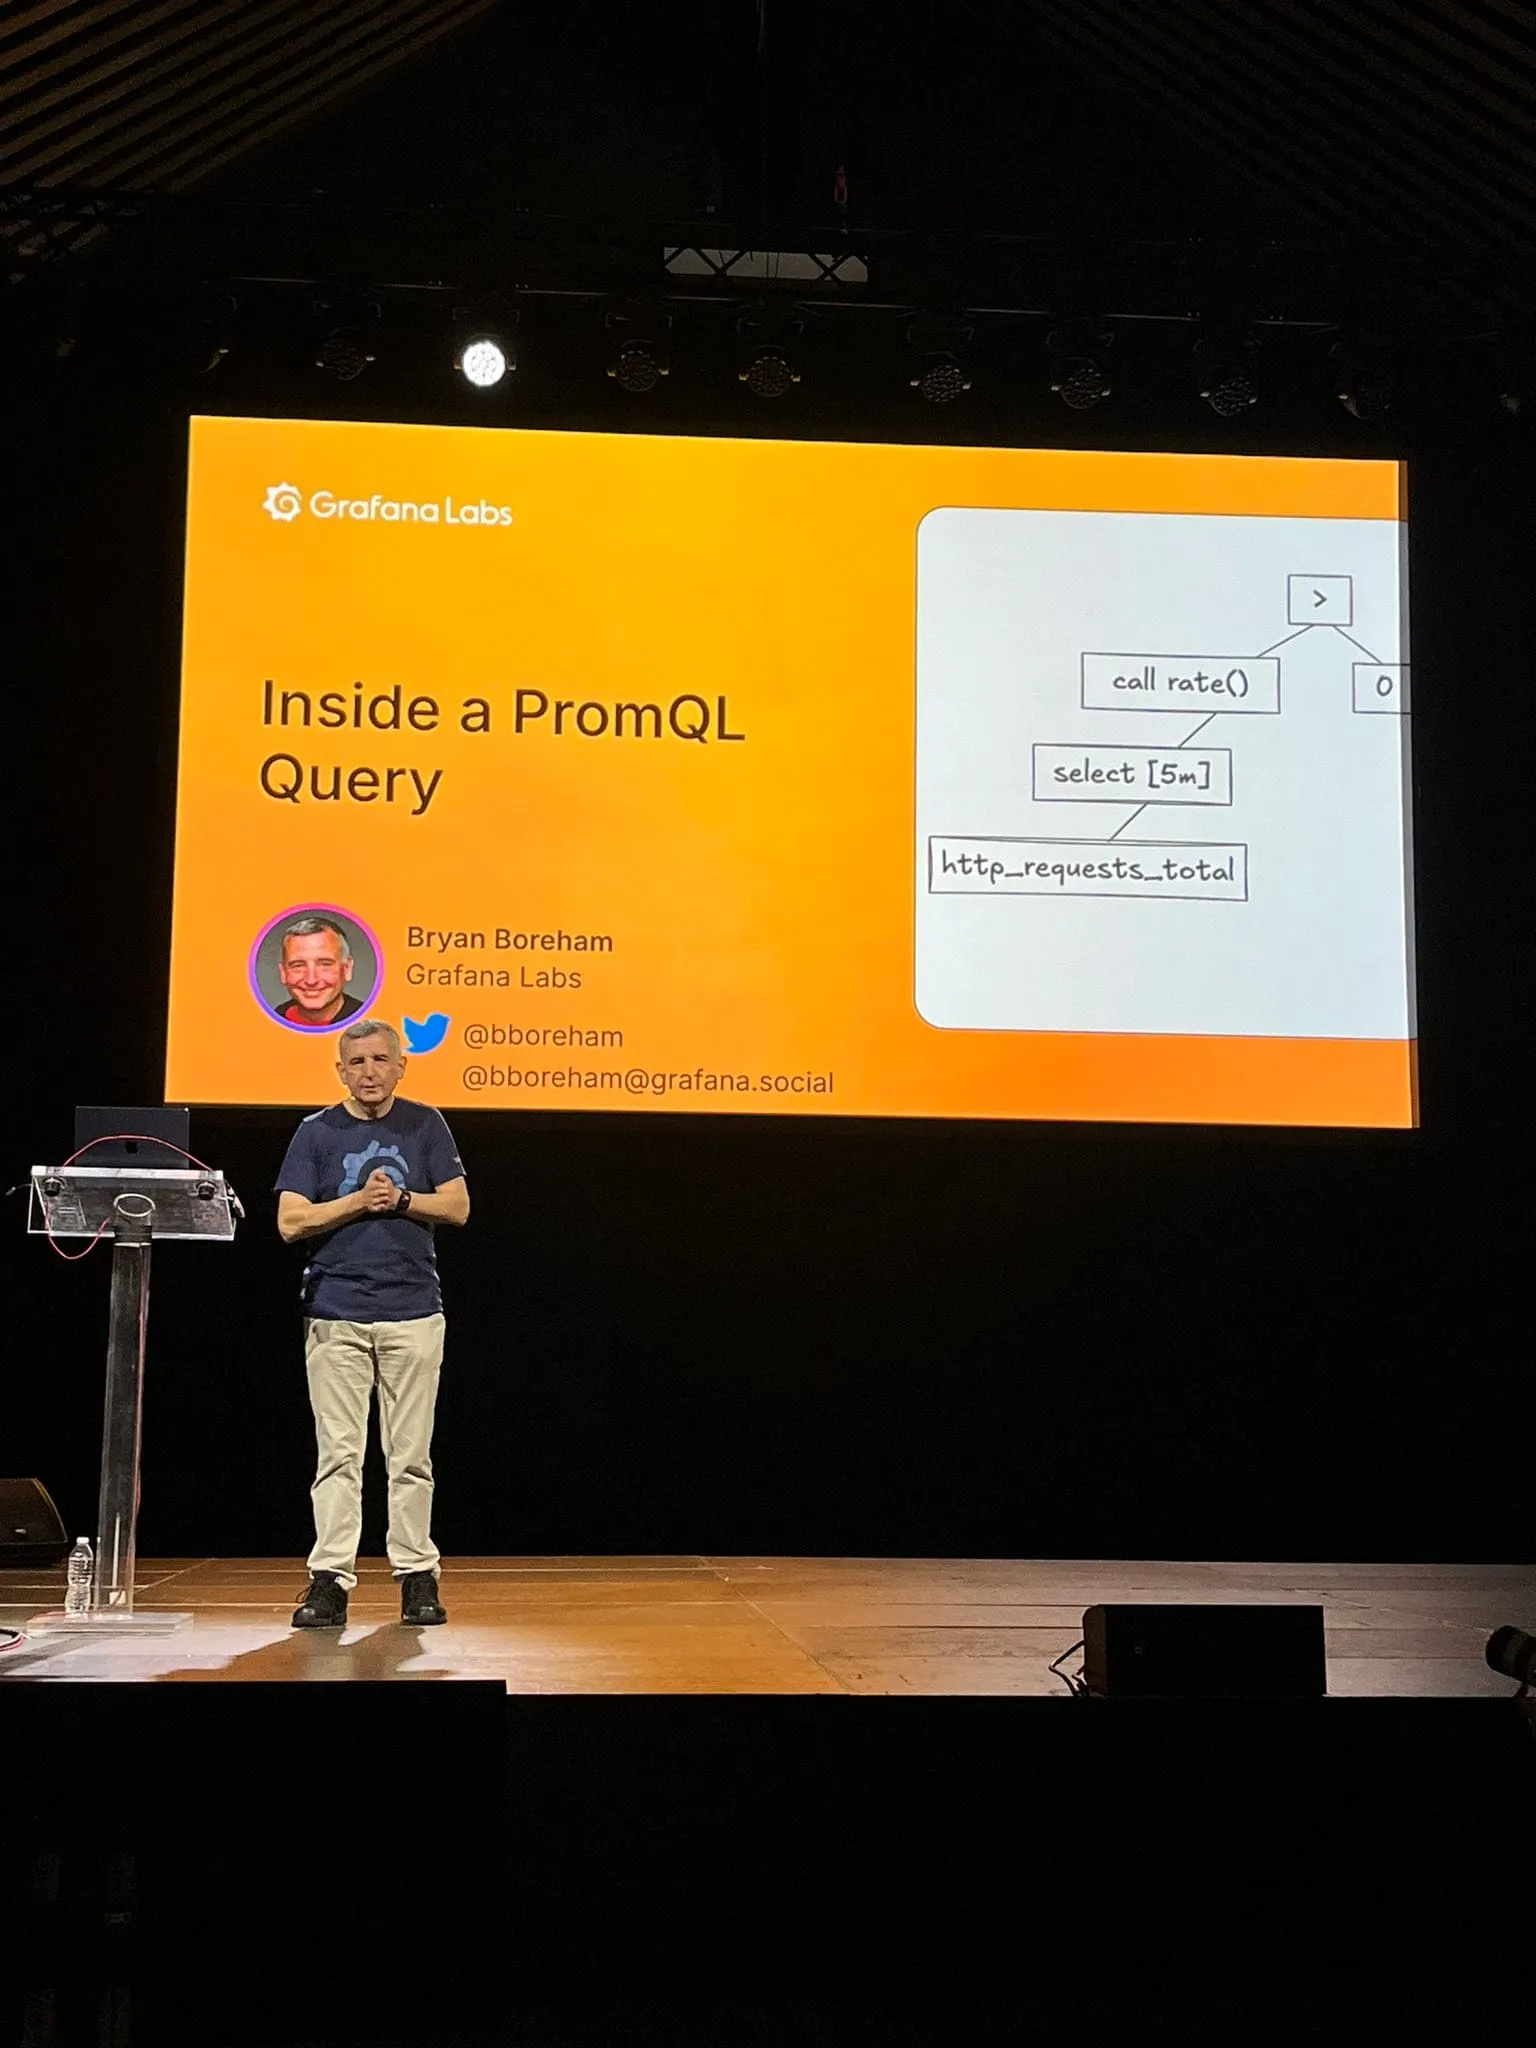
Bryan kicked things off by breaking down how PromQL queries work behind the scenes. His talk offered a clear look at the mechanics of these queries and shared tips on optimizing them for better performance.
The Key to Go Efficiency is Just a Few Prometheus Metrics Away! – Arianna Vespri
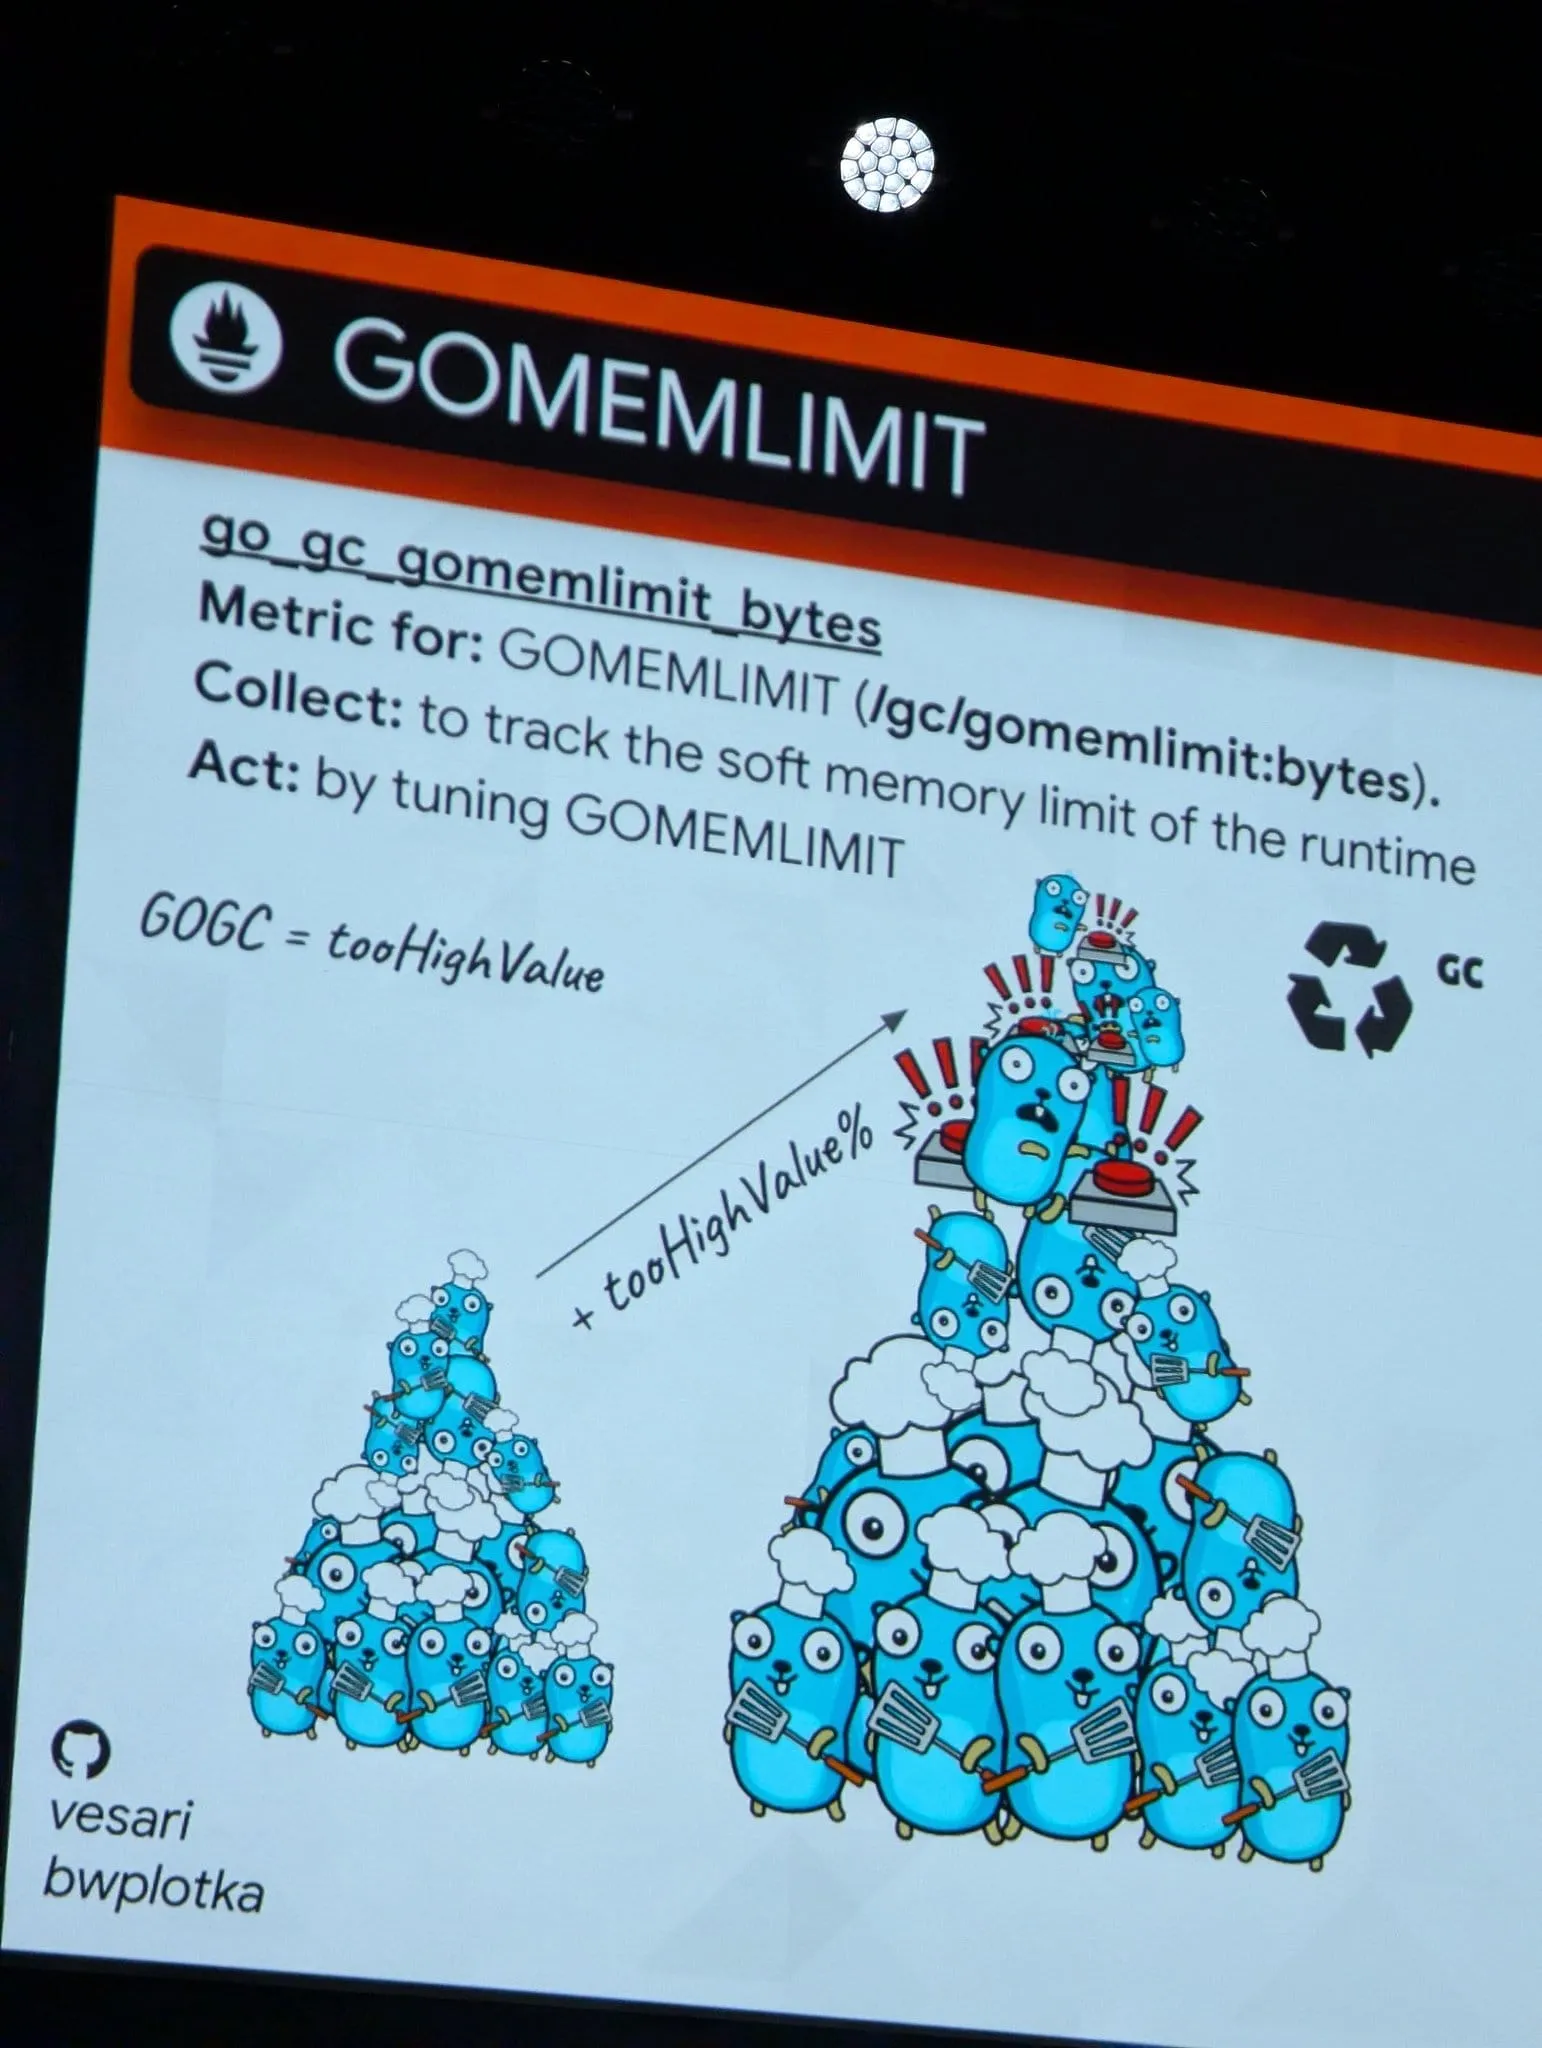
Ariana showed how monitoring critical Prometheus metrics can greatly improve Go applications’ efficiency. Her session was all about practical insights developers can use. Many resources explain Go Runtime and its behavior around memory allocations, garbage collection, and goroutine management.
However, Go Runtime also tracks valuable information that can be used to infer the performance and state of your application. Arianna showed how to collect these metrics at scale and use them.
Why Shipping Native Histograms to Our Users Is a Game Changer – Krisztian Fekete
explained how native histograms transform how we store and analyze data in Prometheus. The benefits? More accurate data collection and easier troubleshooting—things that make life much easier for engineers.
The Future of Metadata in Prometheus: Enhancing Storage and Usability – Ganesh Vernekar and Arve Knudsen
walked us through upcoming changes in how Prometheus handles metadata. These improvements are set to make data storage more efficient and user-friendly, which will be useful as systems grow. Additionally, this will unlock OpenTelemetry compatibility with resource attributes being supported as part of the metadata.
Unbreakable Prometheus: Leveraging Limits for Consistent Monitoring – Nicolas Takashi
shared insights into how implementing limits can keep Prometheus running smoothly, even in high-demand environments. His focus was on building resilient systems that don’t buckle under pressure.
Practical Anomaly Detection at Scale with PromQL – Jorge Creixell and Manoj Acharya
dove into the challenges of anomaly detection at scale, showing how PromQL can be used effectively. Their advice was beneficial for teams dealing with large and complex monitoring setups.
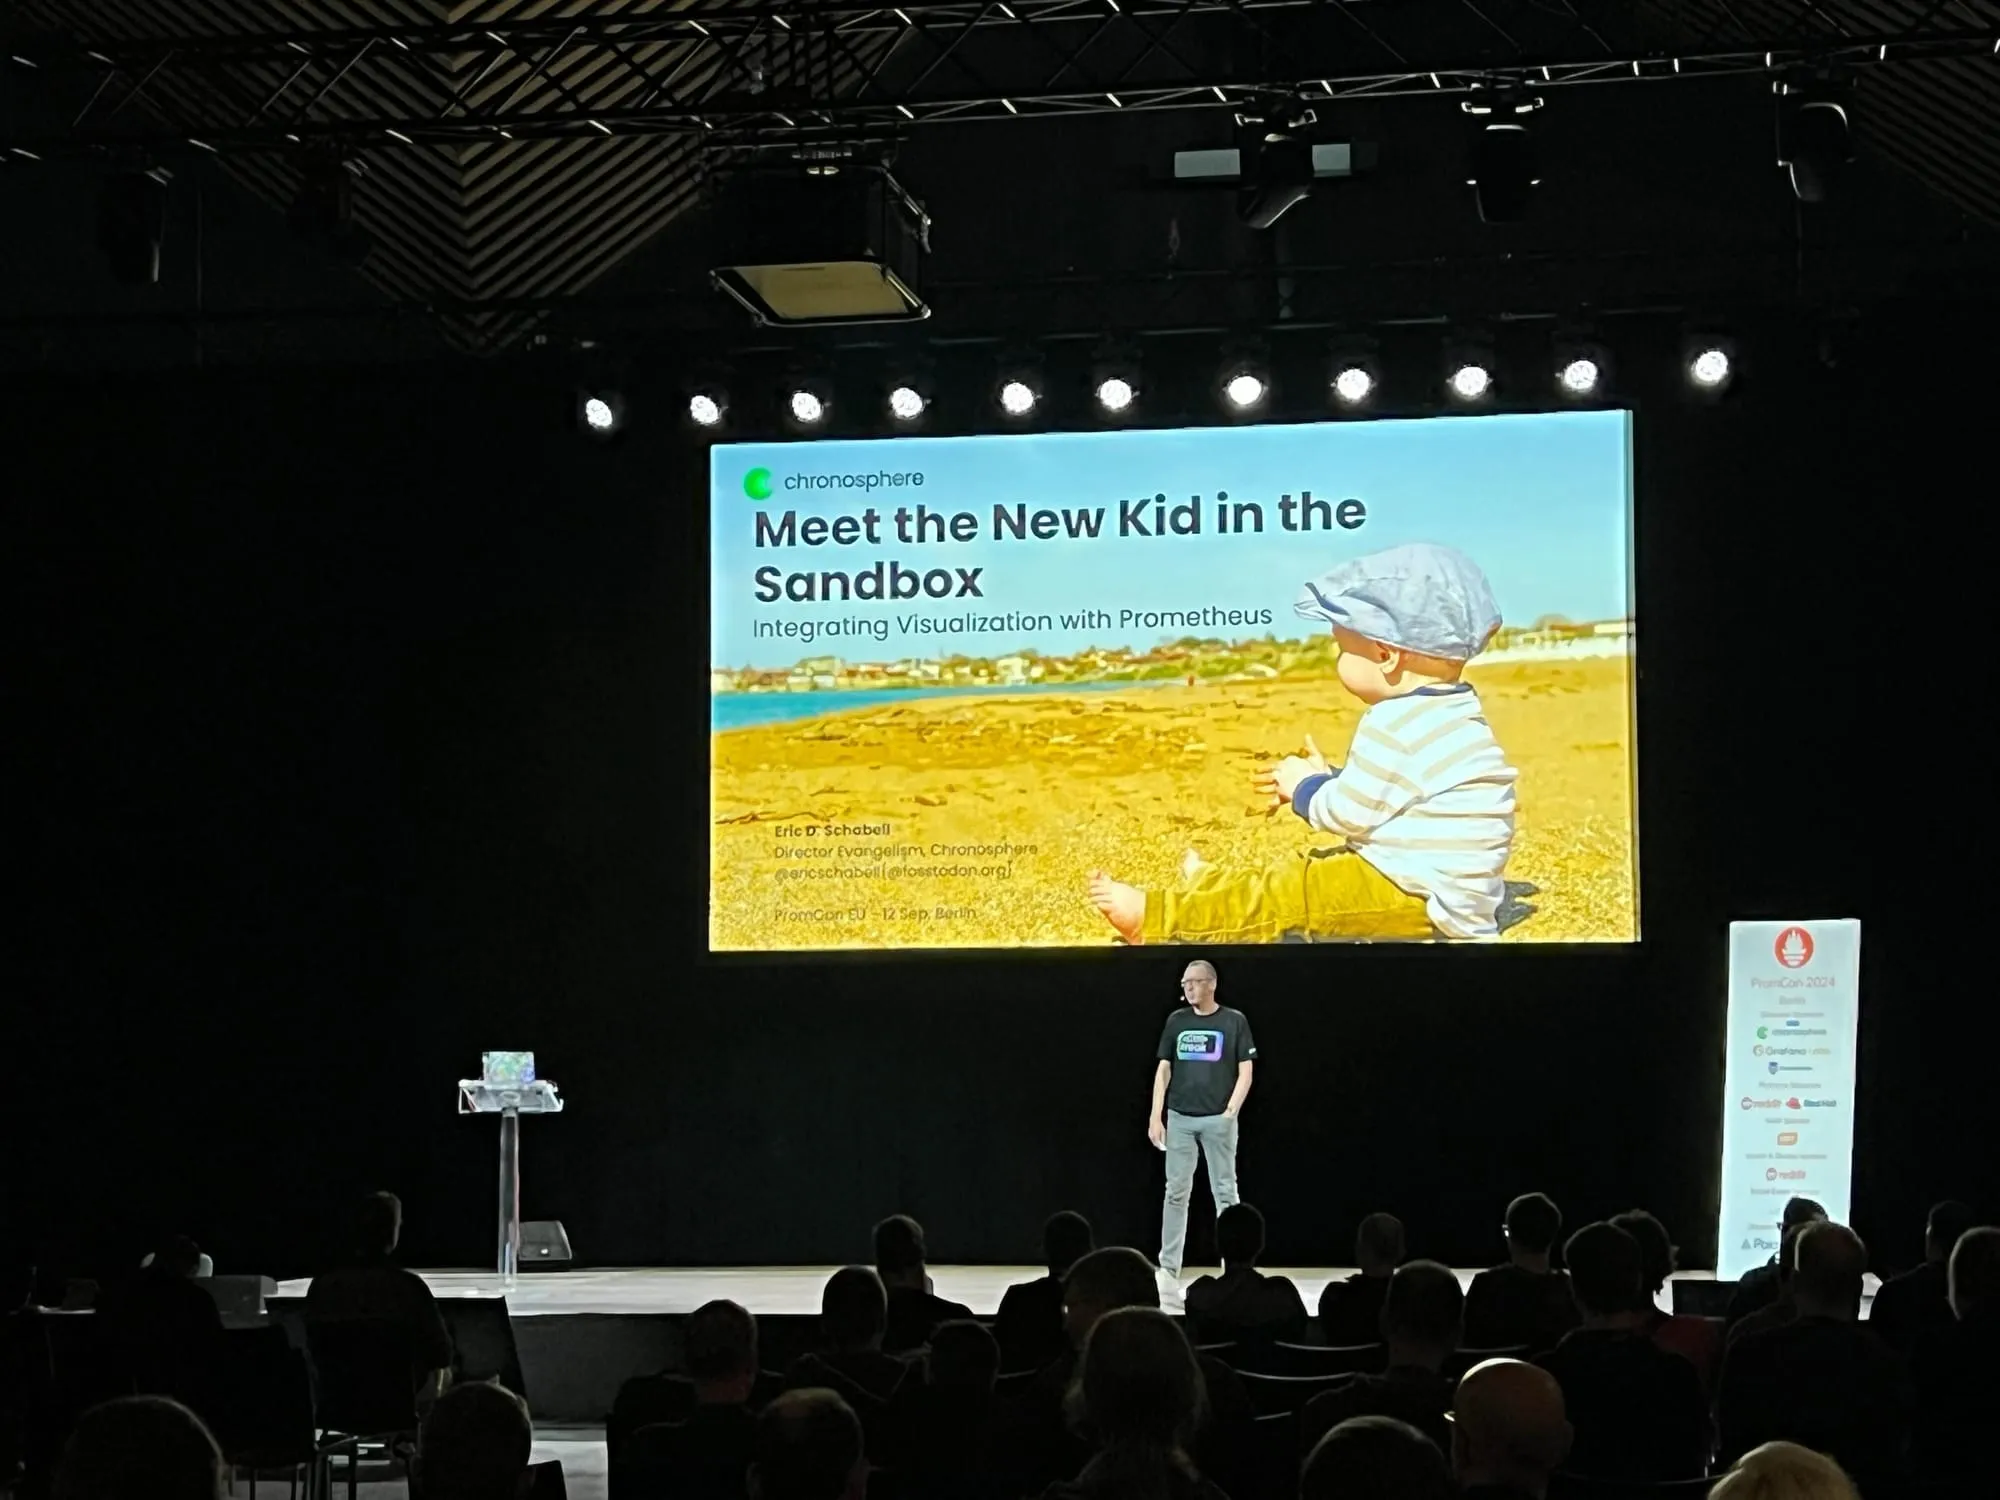
Meet the New Kid in the Sandbox - Integrating Visualization with Prometheus – Eric D. Schabell
Eric introduced Perses for visualizing Prometheus data, making it easier for teams to turn raw data into actionable insights through improved visual elements. Perses was recently included in the CNCF sandbox. Eric covered the history of Perses and some of its key capabilities.
Eric has uploaded his talk’s slides here.
Implementing Out-of-Order Native Histograms in Prometheus – Carrie Edwards and Fiona Liao
explored how handling out-of-order data has improved with native histograms in Prometheus. This technical deep dive was perfect for those managing complex datasets.
Harnessing the Potential of Prometheus Agent Mode – M Viswanath Sai and S Ashwin
discussed how the agent mode in Prometheus can help smooth monitoring in smaller environments, making it easier to capture only what you need without a full Prometheus deployment.
The Weirdest PromQL You’ll Ever See: PromQL for Reporting, Analytics, and Business Intelligence – Sam Jewell
wrapped up the day with a creative look at using PromQL in ways you might not expect—like for business intelligence and reporting. His talk showed how versatile PromQL can really be.
And that’s a wrap!
Even if you can’t be there in person —you’ll still want to catch these talks. Look out for the decks and video recordings as soon as they’re available; they’re worth a watch!
It was amazing attending Promcon 2024 and learning about the Prometheus ecosystem. Thank you, organizers, speakers, and sponsors, for a great event.

