

For Ruby developers, integrating OpenTelemetry offers a standardized approach to collecting and analyzing telemetry data, enhancing the observability of their applications.
In this blog, we’ll talk about setting up OpenTelemetry in your Ruby application, sampling strategies, applications, and more.
For more insights on optimizing OpenTelemetry for your applications, check out Last9’s OpenTelemetry blog posts.
Step-by-Step Guide: Setting Up OpenTelemetry in Ruby
Integrating OpenTelemetry into your Ruby application allows you to capture telemetry data for improved observability. Follow these steps to set up OpenTelemetry in your Ruby project.
1. Install OpenTelemetry SDK and Instrumentation Packages
Ensure your application is running Ruby 2.5 or higher, then add the necessary gems to your Gemfile:
gem 'opentelemetry-sdk'gem 'opentelemetry-instrumentation-all'Run the following command to install the dependencies:
bundle install2. Configure the OpenTelemetry SDK
Create an initializer file (e.g., config/initializers/opentelemetry.rb) and configure the SDK:
require 'opentelemetry/sdk'
OpenTelemetry::SDK.configure do |c|  c.use_allend
This setup enables all available instrumentation, automatically capturing telemetry data from supported libraries and frameworks.
3. Setting Up an Exporter to Visualize Telemetry Data
To visualize and analyze telemetry data, configure an exporter to send data to your observability backend. For example, to use the OpenTelemetry Protocol (OTLP) exporter, add the following configuration:
require 'opentelemetry/exporter/otlp'
OpenTelemetry::SDK.configure do |c|  c.use_all  c.add_span_processor(    OpenTelemetry::SDK::Trace::Export::BatchSpanProcessor.new(      OpenTelemetry::Exporter::OTLP::Exporter.new(endpoint: 'http://localhost:4317')    )  )end
Replace 'http://localhost:4317' with the endpoint of your observability backend. This ensures that trace data is properly exported and can be monitored effectively.
To understand the differences between OpenTelemetry and OpenMetrics and how they complement each other, read this detailed comparison.
How to Instrument a Ruby Application
OpenTelemetry provides two methods for instrumenting your Ruby application: automatic instrumentation and manual instrumentation for both traces and metrics.
1. Automatic Instrumentation
For most applications, automatic instrumentation is the simplest way to capture telemetry data. The opentelemetry-instrumentation-all gem automatically instruments popular frameworks such as Rails, Sinatra, and ActiveRecord, requiring minimal configuration.
If you followed the setup steps earlier, automatic instrumentation is already enabled, allowing OpenTelemetry to capture traces without additional code.
2. Manual Instrumentation
Capturing Traces
For custom code or unsupported libraries, manual instrumentation lets you create spans and add attributes to track specific operations. Use the opentelemetry-api gem to manually define traces:
require 'opentelemetry-api'
tracer = OpenTelemetry.tracer_provider.tracer('my_app_or_library', '1.0.0')
tracer.in_span('my_custom_operation') do |span|  # Your custom code here  span.set_attribute('custom_attribute', 'value')end
This approach provides granular control over how and when telemetry data is captured, making it useful for tracking specific operations that aren’t automatically instrumented.
Capturing Metrics
To collect numerical performance data (e.g., request count, response time, memory usage), use OpenTelemetry’s metrics API:
require 'opentelemetry-api'
meter = OpenTelemetry.meter_provider.meter('my_app_or_library', '1.0.0')
# Create a counter metricrequest_counter = meter.create_counter('requests.count', description: 'Total number of requests')
# Increment the counterrequest_counter.add(1, attributes: { 'endpoint' => '/home' })
Common Use Cases for Metrics:
- Counters: Track request count, error occurrences, and database queries.
- Histograms: Measure request duration, memory usage, and queue size.
- UpDownCounters: Track active users, open connections, or running jobs.
Check out our full guide on configuring OpenTelemetry using environment variables.
Sending Telemetry Data to Observability Platforms
OpenTelemetry supports multiple exporters to transmit telemetry data to different observability platforms. While the OTLP exporter is the default choice, you can configure other exporters based on your observability setup.
An exporter in OpenTelemetry refers to a component that sends collected telemetry data to an external system for storage, analysis, and visualization. Choose an exporter that aligns with your observability infrastructure and integrates easily with your monitoring tools.
1. Jaeger Exporter
To export traces to Jaeger, configure the opentelemetry-exporter-jaeger gem:
require 'opentelemetry/exporter/jaeger'
OpenTelemetry::SDK.configure do |c|  c.use_all  c.add_span_processor(    OpenTelemetry::SDK::Trace::Export::BatchSpanProcessor.new(      OpenTelemetry::Exporter::Jaeger::AgentExporter.new(host: 'localhost', port: 6831)    )  )end
Note: Replace 'localhost' and 6831 with your Jaeger agent’s actual host and port.
2. Zipkin Exporter
To export traces to Zipkin, configure the opentelemetry-exporter-zipkin gem:
require 'opentelemetry/exporter/zipkin'
OpenTelemetry::SDK.configure do |c|  c.use_all  c.add_span_processor(    OpenTelemetry::SDK::Trace::Export::BatchSpanProcessor.new(      OpenTelemetry::Exporter::Zipkin::Exporter.new(endpoint: 'http://localhost:9411/api/v2/spans')    )  )end
Note: Replace 'http://localhost:9411/api/v2/spans' with your Zipkin endpoint.
3. Exporting to Last9
Prerequisites
Before getting started, ensure you have:
- A Last9 account with an active cluster
- The following OTLP credentials from the Last9 Integrations page:
endpointauth_header
Since you’ve already installed OpenTelemetry Packages, we’ll move to the next section Configuring Environment Variables.
Configure Environment Variables
Create a .env file in your project’s root directory and add the following variables:
OTEL_SERVICE_NAME=ruby-on-rails-api-serviceOTEL_EXPORTER_OTLP_ENDPOINT=<ENDPOINT>OTEL_EXPORTER_OTLP_HEADERS="Authorization=Basic <BASIC_AUTH_HEADER>"OTEL_TRACES_EXPORTER=otlpNote: Replace <BASIC_AUTH_HEADER> with the URL-encoded value of the basic auth header.
Instrument Your Application
Create an initializer file at config/initializers/opentelemetry.rb and add the following code:
require 'opentelemetry/sdk'require 'opentelemetry/exporter/otlp'require 'opentelemetry/instrumentation/all'
# Configure OTLP Exporter and Span Processorotel_exporter = OpenTelemetry::Exporter::OTLP::Exporter.newprocessor = OpenTelemetry::SDK::Trace::Export::BatchSpanProcessor.new(otel_exporter)
OpenTelemetry::SDK.configure do |c|  c.add_span_processor(processor)
  # Define application metadata  c.resource = OpenTelemetry::SDK::Resources::Resource.create({    OpenTelemetry::SemanticConventions::Resource::SERVICE_NAME => 'ruby-on-rails-api-service',    OpenTelemetry::SemanticConventions::Resource::SERVICE_VERSION => "0.0.0",    OpenTelemetry::SemanticConventions::Resource::DEPLOYMENT_ENVIRONMENT => Rails.env.to_s  })
  c.use_all # Enable instrumentation for all standard componentsend
This setup configures OpenTelemetry to use the OTLP exporter and automatically instruments all key components in your Rails application.
Start Your Application
Launch your Rails app with:
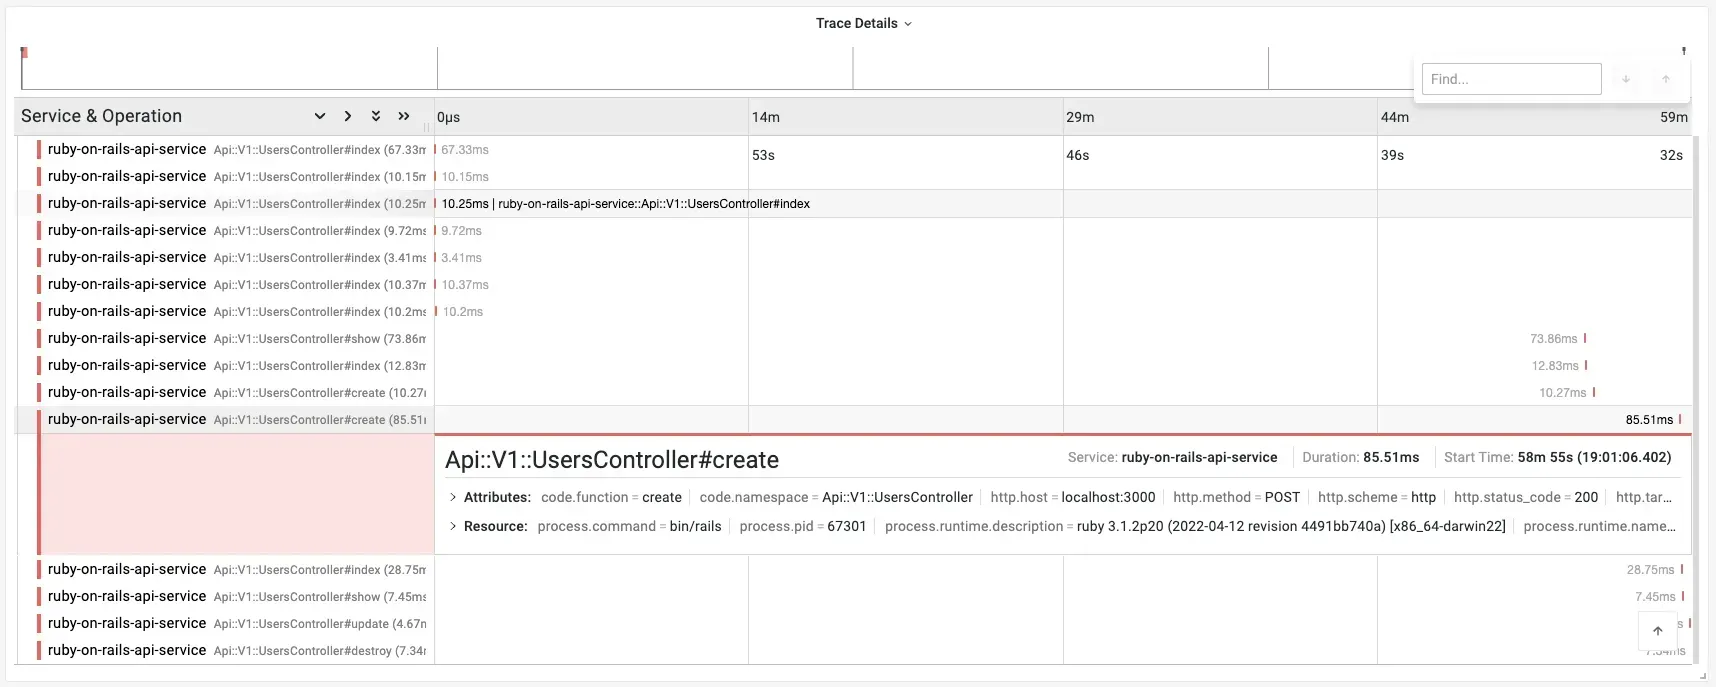
bin/rails serverVisualize Traces in Last9
Once your application is running, you can monitor and analyze traces in the Last9 APM dashboard. This gives you real-time insights into application performance, request latencies, and potential bottlenecks.
Learn how OpenTelemetry extends beyond tracing and metrics with profiling by reading this detailed guide.
How to Manage Trace Sampling in OpenTelemetry Ruby
In high-traffic or distributed systems, recording every trace can lead to a mountain of data—impractical to store, analyze, or pay for. Sampling keeps things manageable by capturing a representative slice of your telemetry data, providing insights without slowing everything to a crawl.
OpenTelemetry Ruby provides several sampling strategies to fit different needs.
1. TraceIdRatioBased Sampling
This strategy samples traces based on a fixed ratio. The sampling rate is set between 0.0 (capture nothing) and 1.0 (capture everything).
Example: Sample 10% of traces
require 'opentelemetry/sdk'
sampler = OpenTelemetry::SDK::Trace::Samplers::TraceIdRatioBased.new(0.1) # 10% sampling
OpenTelemetry::SDK.configure do |c|  c.use_all  c.sampler = samplerend
Use case: Useful when you want a consistent percentage of traces to get a lightweight performance overview without overwhelming storage.
2. Always On Sampling
Captures 100% of traces, ensuring complete visibility. Ideal for debugging and mission-critical applications where every request matters.
Example: Enable Always On
require 'opentelemetry/sdk'
sampler = OpenTelemetry::SDK::Trace::Samplers::AlwaysOn.new
OpenTelemetry::SDK.configure do |c|  c.use_all  c.sampler = samplerend
Use case: Best for high-priority environments requiring full observability.
3. Always Off Sampling
Disables telemetry collection entirely. Typically used for testing scenarios where observability data isn’t needed.
Example: Disable Sampling
require 'opentelemetry/sdk'
sampler = OpenTelemetry::SDK::Trace::Samplers::AlwaysOff.new
OpenTelemetry::SDK.configure do |c|  c.use_all  c.sampler = samplerend
Use case: Helpful in debugging or controlled test environments where telemetry may interfere with expected behavior.
4. Custom Sampling Logic
For more control, you can define custom sampling rules based on context, attributes, or specific conditions.
Example: Sample traces with even trace IDs
require 'opentelemetry/sdk'
class CustomSampler < OpenTelemetry::SDK::Trace::Samplers::Sampler  def should_sample?(context, trace_id, span_name, attributes)    trace_id % 2 == 0 # Sample only even trace IDs  endend
OpenTelemetry::SDK.configure do |c|  c.use_all  c.sampler = CustomSampler.newend
Use case: Tailored for business-specific logic, such as sampling high-value transactions or filtering by user type.
How to Choose the Right Sampling Strategy
| Strategy | Best For |
|---|---|
| TraceIdRatioBased | General-purpose sampling to balance performance & observability |
| Always On | Debugging or mission-critical applications where full trace data is required |
| Always Off | Testing or development environments where telemetry isn’t needed |
| Custom Sampling | Fine-grained control over which requests to sample |
Understand how to capture and analyze events in OpenTelemetry by exploring this in-depth guide.
Adjusting Sampling Dynamically in OpenTelemetry Ruby
Static sampling rates work well, but dynamic adjustments can help optimize observability based on system conditions.
For example:
- High traffic: Increase the sampling rate to capture more traces.
- Low traffic: Decrease the rate to save resources.
This can be managed programmatically by adjusting the sample rate based on request volume, error occurrences, or specific conditions.
Monitoring Your Sampling Strategy
To ensure your sampling strategy is effective, monitor:
- Performance Impact – Watch for CPU/memory overhead caused by excessive tracing.
- Data Completeness – Ensure enough traces are collected to identify issues and optimize performance.
Fine-tuning sampling ensures that OpenTelemetry captures relevant insights without unnecessary overhead.

Who’s Using OpenTelemetry in Ruby—And Why You Should Too
OpenTelemetry is making waves across industries, and Ruby developers are no exception. Whether you’re working on a Rails app, microservices, or an e-commerce platform, OpenTelemetry helps you track performance, troubleshoot issues, and improve reliability.
Here’s how different types of applications are using OpenTelemetry—and how you can, too.
1. Ruby on Rails Applications
If you’re running a Rails app, OpenTelemetry gives you deep insights into performance. It helps you trace requests, database queries, and external API calls, so you can spot bottlenecks before they impact users.
Why use it?
- Request tracing – See the full journey of a request, from start to finish.
- Database insights – Automatically track ActiveRecord queries and optimize slow ones.
2. Microservices Architectures
Running a microservices setup? OpenTelemetry makes it easy to trace requests across services and detect latency issues. No more guessing where a failure started—get full visibility into your system.
Key benefits:
- Distributed tracing – Connect requests across services and pinpoint failures.
- Service dependency mapping – Understand how services interact and where performance drops.
3. E-Commerce Platforms
If your e-commerce platform is slow, you lose sales. OpenTelemetry helps you track transactions, monitor checkout flows, and detect performance issues in real-time.
How it helps:
- Transaction tracing – Follow the user journey from the homepage to checkout.
- Real-time monitoring – Catch issues before they impact customers.
4. SaaS and Cloud-Native Applications
Scaling a SaaS or cloud-native app? OpenTelemetry gives you the observability you need to track API performance, monitor cloud infrastructure, and ensure uptime.
What you get:
- Cloud monitoring – Watch database, storage, and messaging service performance.
- API latency tracking – Ensure fast, reliable API responses for users.
Learn how context propagation works in OpenTelemetry and why it’s essential for distributed tracing in this detailed guide.
5. Financial Services and Fintech
If you’re in fintech or financial services, OpenTelemetry provides transparency into transaction flows, latency, and compliance tracking.
Why it’s useful:
- Transaction monitoring – Identify processing delays and service disruptions.
- Compliance auditing – Log transactions to meet regulatory requirements.
6. Gaming and Entertainment
For gaming and streaming platforms, performance is everything. OpenTelemetry helps track real-time user interactions and detect latency issues before they ruin the experience.
How it helps:
- Latency monitoring – Ensure smooth, lag-free gameplay or streaming.
- User behavior insights – See how players interact and optimize performance.
7. DevOps and CI/CD Pipelines
If you’re working in DevOps, OpenTelemetry helps you monitor your CI/CD pipelines, detect build failures, and optimize deployments.
Key benefits:
- Pipeline monitoring – Catch issues early in the build/test/deploy cycle.
- Staging vs. production monitoring – Ensure consistent performance across environments.
8. IoT (Internet of Things) Applications
For IoT applications, OpenTelemetry provides critical visibility into device health, network communication, and real-time telemetry.
What you can do:
- Device monitoring – Track performance and prevent failures.
- Network visibility – Ensure smooth communication between connected devices.
Conclusion
OpenTelemetry in Ruby empowers developers with a robust observability framework. Regularly revisiting and refining your sampling strategy ensures it aligns with evolving application needs, helping maintain reliable and well-monitored systems.
If you’d like to explore further, join our community on Discord! We have a dedicated channel where you can discuss your specific use case with fellow developers.

