

Your AI agent worked flawlessly in development, with fast responses, clean tool use, and nothing out of place. Then it hit production. A simple “What’s our pricing?” query triggered six API calls, took 8 seconds, and returned the wrong answer. No errors. No stack traces.
Unlike traditional systems, AI agents don’t crash, they drift. They make poor decisions quietly, and your monitoring says everything’s fine. That disconnect between dev and prod is why debugging agents require more than just logs and metrics. You need frameworks that bring structure to unpredictable behavior.
LangChain and LangGraph help you build those systems. But they won’t tell you why your agent made the wrong call in production. For that, you need observability.
This blog breaks down how these frameworks work and what you need to observe, debug, and trust AI agents in production.
The Real Challenges of Running AI Agents in Production
Traditional applications are easy to reason about, same input, same output. AI agents, especially ones powered by LLMs, work in a different way, enabling more advanced ai agent orchestration. Their responses depend on prior context, intermediate reasoning steps, model behavior, and even subtle shifts in phrasing. That makes them harder to debug, harder to predict, and harder to optimize.
Here’s what that looks like in production:
1. Logs won’t identify this
In most systems, when something fails, you get an error or a stack trace. With agents, failure is subtle. The system returns something, just not what you expected.
A reasoning step goes off track. The wrong tool is called. The format slightly changes, breaking downstream logic. Or the agent gets stuck in a loop, unable to decide.
There’s no panic, no obvious failure. Just a confusing result and no clue where it came from.
2. Performance doesn’t fail loudly either—it just gets slower
That quick 100ms response you saw during local testing? In production, it quietly turns into 6 seconds. You check your infra metrics, CPU’s fine, memory’s fine, but latency keeps creeping up.
Here’s what usually causes it:
- Context bloat: Every interaction adds tokens. That context gets passed to the LLM, increasing processing time.
- Tool chaining: One tool calls another. Then another. Each step adds delay.
- Model variance: Even with the same input, response time can fluctuate depending on load or internal state.
- External APIs: A third-party service slows down or fails, but the agent doesn’t report it. It just keeps going. This is especially common with actions like sending emails: there’s often no confirmation, and the workflow moves on as if it succeeded
And since most observability tools only track system health, you get no insight into what caused the slowdown.
3. Costs follow the same pattern—no alerts, just burn
LLM-based systems don’t come with predictable cost ceilings. A single retry loop or memory-heavy prompt can quietly inflate usage. And unless you’re measuring what each step costs, you won’t know what went wrong until the bill shows up.
Some common patterns:
- Retries on silent failure: A tool call fails and retries multiple times by default. No error, just 3x the token usage.
- Overloaded context: Too much memory pulled into every LLM call. More tokens, higher cost.
- Tool thrashing: The agent keeps bouncing between tools without resolving anything. API calls pile up.
- Prompt drift: A small prompt tweak results in longer, more expensive execution paths.
These issues don’t come from infrastructure; they stem from how the agent is structured. You need structure, and that’s exactly what LangChain offers.
To understand why observability needs to shift for LLM systems, this post lays out the challenges and what to focus on instead.
What Is LangChain?
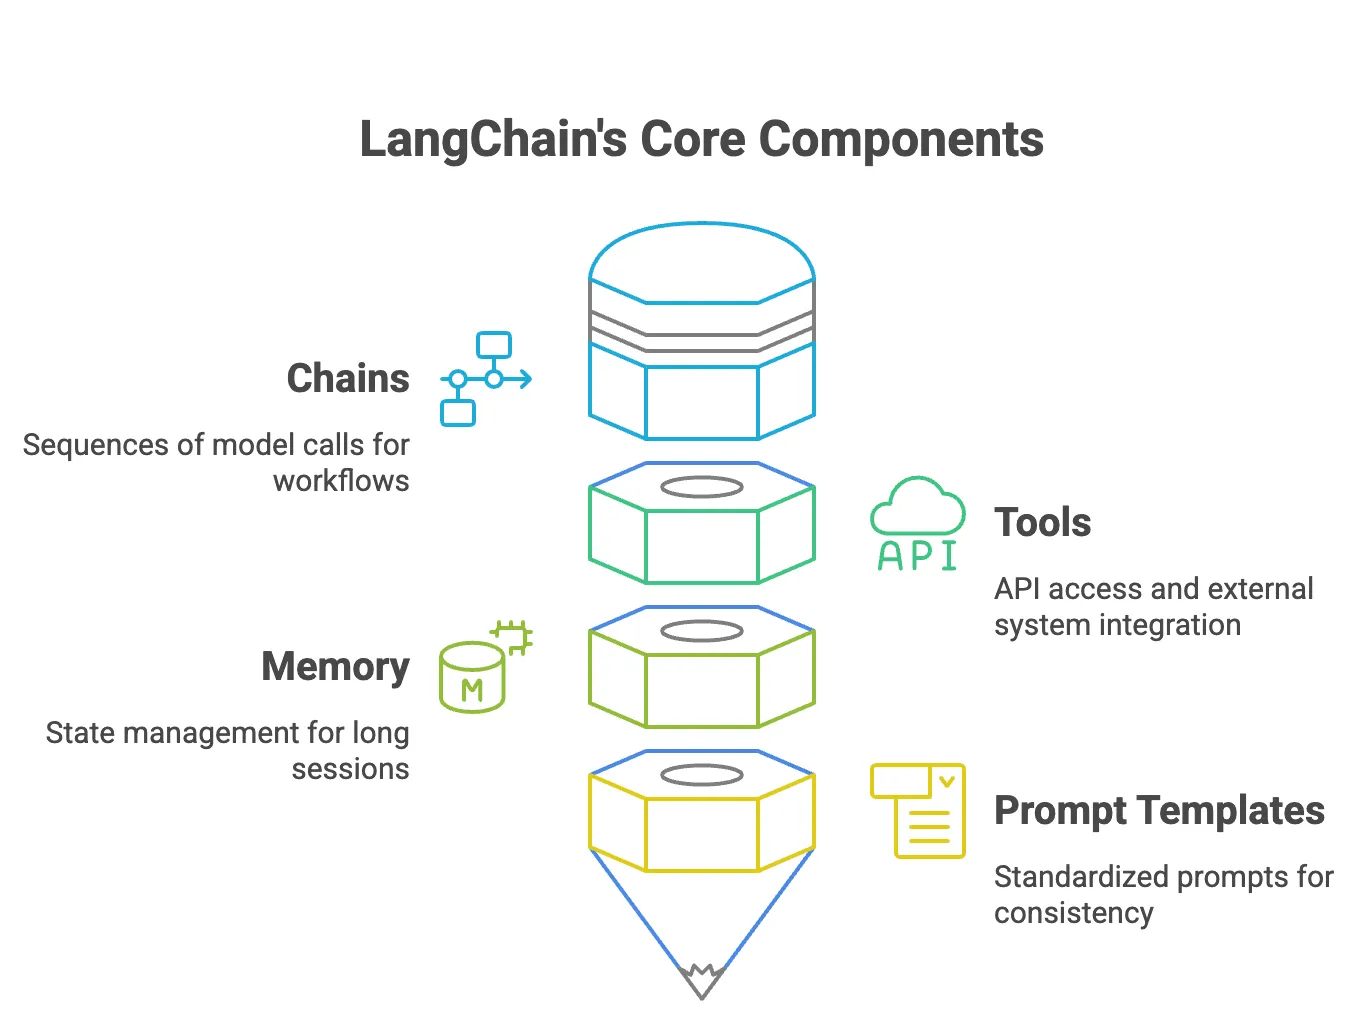
LangChain gives you the foundational components for building LLM-powered applications. These include:
- Chains – Compose a sequence of model calls where the output of one step feeds into the next. Ideal for workflows like rewrite → summarize → respond.
- Tools – Allow agents to call APIs, run calculations, query databases, or access external systems. These extend the LLM beyond text generation.
- Memory – Provides state across turns. Useful for chatbots or long-running sessions that need to remember earlier steps or context.
- Prompt Templates – Standardize prompts so your app doesn’t rely on scattered strings. Helpful for reusability, consistency, and testing.
These components help you move quickly in development. But in production, they often become invisible failure points.
Where Things Break in Production
LangChain is flexible by design. That flexibility becomes a liability without proper visibility.
Prompt templates introduce drift
A minor update to a prompt, changing word order or formatting can cause major behavior shifts. And without capturing the actual prompt sent, it’s nearly impossible to debug.
template = PromptTemplate.from_template("Translate '{text}' to French")Memory grows invisibly
As conversation history grows, so does the token count passed to the LLM. A 300-token exchange turns into 3000+ tokens, increasing cost and latency. But unless you’re logging memory state, you won’t notice until it hurts.
memory = ConversationBufferMemory()Tools silently retry or fail
When a tool times out or throws a warning, LangChain might retry without surfacing anything. You’ll see higher latency, more API calls, and degraded performance, without logs explaining why.
tools = load_tools(["serpapi", "python_repl"])Chains fail silently
A formatting change in one step—like an extra newline—can break the next. A summarizer might receive malformed input and return junk output. No error is thrown, but the logic quietly fails.
rewrite_prompt = PromptTemplate.from_template("Rewrite this professionally: {text}")summary_prompt = PromptTemplate.from_template("Summarize this: {text}")LangChain doesn’t block these failures; it assumes your system can handle them. Without observability, that’s a risky bet. Once you start building actual workflows, connecting tools, chaining model calls, and adding memory, issues don’t show up in isolation. They emerge from how the pieces interact.
The Composition Problem
Composing LLM pipelines isn’t like composing APIs. You’re passing unstructured text between steps, not typed data. And that introduces a different class of failure.
Example:
Let’s say Step A extracts a user request:
{ "intent": "get_balance", "account": "checking" }But Step B expects the field to be "account_type". Now, imagine Step A adds this instead:
{ "intent": "get_balance", "type": "checking" }There’s no type-check error. No exception. Step B just returns:
"Sorry, I couldn't find the requested account."It looks like user error. It’s formatting drift.
This happens because:
- LLM output is plain text, not structured or validated
- Prompt outputs can change across model versions or even due to unrelated prompt tweaks
- You don’t get a crash, you get degraded behavior
Without traces, you can’t see:
- What Step A returned
- How Step B interpreted it
- Where the logic fell apart
And once tools enter the picture, things get even more unpredictable.
Tools Don’t Always Work as Expected
Once your agent has tools, every execution step becomes a decision. Which tool should it call? In what order? What if one fails? Should it try again or back off?
This flexibility introduces new failure modes:
- Tool thrashing – The agent bounces between tools without making progress.
- Context drift – Important details get dropped, misinterpreted, or overwritten between steps.
- Silent failure – A tool errors out, but the agent continues, possibly with broken assumptions.
You can’t fix these with prompt tweaks. These are behavioral problems, not prompt problems. And without step-by-step visibility into how decisions are made, you’re left guessing why your agent responded the way it did.
LangChain gives you the core building blocks. But once you’re running agents in production—and reliability, performance, and cost start to matter—you’ll want more structure.
That’s where LangGraph helps you.
How LangGraph Works
LangGraph is a framework built on top of LangChain. It lets you express your agent’s control flow as a graph—a set of nodes (actions) and edges (transitions). Each node can call a tool, summarize data, generate a response, or trigger another decision. The edges define how the agent moves between steps.
What’s different? The transitions between nodes are dynamic. They change at runtime based on what the agent sees or decides.
Here’s a simple example:
from langgraph.graph import StateGraph, ENDfrom langchain.llms import OpenAI
llm = OpenAI()
def analyze(state):    return {"step": "search", "data": ...}
def search(state):    return {"step": "respond", "results": ...}
def respond(state):    return END
graph = StateGraph()graph.add_node("analyze", analyze)graph.add_node("search", search)graph.add_node("respond", respond)
graph.set_entry_point("analyze")graph.add_edge("analyze", "search")graph.add_edge("search", "respond")
workflow = graph.compile()
This example is linear, but in production, each node can have its retry logic, branching conditions, fallback paths, or pause points. The execution flow is driven by shared state, not just fixed wiring. That’s what makes LangGraph composable.
Why LangGraph Works Better in Production
LangGraph isn’t just flexible, it’s designed for real-world reliability. Agents in production need to handle flaky APIs, dynamic reasoning paths, and the ability to pause or retry without breaking.
Some things LangGraph makes easier:
- Conditional routing – Let the agent choose what happens next, based on confidence or output shape.
- Parallel execution – Run multiple tools simultaneously and combine their results downstream.
- Retry and fallback – If a tool fails, take a different path without restarting the whole workflow.
- Looping – Allow the agent to revisit previous steps until it gets a satisfactory result.
- Pause and resume – Wait for human input or external signals, then continue execution.
These aren’t edge cases. They’re normal behavior once agents move out of dev and into real systems.
Built-in Checkpointing
LangGraph includes checkpointing by default. It lets you persist the state of the workflow and resume from where it left off, whether the process crashed, hit a timeout, or paused for human input.
That makes fault-tolerant agents possible, but it also comes with real-world concerns:
- Is the saved state complete and consistent?
- What happens if only part of the graph is executed before failure?
- How do you resume safely if the workflow logic has changed?
LangGraph gives you hooks to manage state versioning, validation, and recovery—so agents don’t just fail gracefully, they continue reliably.
Now that we’ve seen how each framework works, let’s look at what typically breaks in LLM systems.
Production Challenges in LLM Systems
The real test begins when it runs continuously in production, handling unpredictable user input, flaky third-party APIs, and edge cases you didn’t plan for. Here are some of the issues you might hit:
Logs Don’t Capture Agent Behavior
In traditional systems, a failed database query throws a clear error. A misconfigured service returns a 500. But LLM agents fail silently. They don’t crash—they just make the wrong call and move on.
Take this scenario:
A user asks: “Do I get charged for changing my plan mid-cycle?”
The agent retrieves an internal doc, summarizes it, and replies: “You can change your plan at any time.”
Nothing broke. No errors in logs. But the answer is wrong—the user does get charged under some conditions.
The issue wasn’t a system failure:
- The retriever missed a crucial clause on prorated billing
- The summarizer compressed too aggressively
- The agent didn’t signal low confidence—it just responded
And because the system “worked,” you won’t find this in any logs.
What you need to debug this:
- A view of what documents were retrieved
- Intermediate outputs between reasoning steps
- Tool choices and the state that led to them
This isn’t log-level debugging. It’s tracing the agent’s reasoning—and understanding how each step influenced the final result.
Healthy Dashboards Can Hide Latency
Traditional monitoring often focuses on infra: CPU, memory, disk, network. But agent latency usually isn’t caused by infrastructure; it’s caused by behavior.
You’ll see this pattern often:
- A direct question resolves in 300ms
- A vague or multi-turn query balloons to 6 seconds
- A poorly scoped request results in over-fetching, retries, and fallback chains
Latency in LLM agents comes from:
- Context size: Long memory buffers silently inflate token counts
- Tool overhead: External APIs add variable latency
- Retries: Failures silently trigger fallback logic
- Prompting patterns: A subtle change leads to multi-hop reasoning
You need per-request traces to see:
- Which tool call was the bottleneck
- How many steps were involved
- Whether the agent got stuck in a retry loop
Without this, your dashboards stay green while users wait.
Cost Creeps In Through Hidden Behaviors
Everyone tracks token usage. But that’s only part of the story. The real cost comes from behaviors that amplify usage silently, like retries, memory bloat, and unnecessary tool calls.
Here’s what that might look like:
- The agent retries failed API calls three times, by default, and without logging
- Memory context pulls in an entire conversation instead of just recent turns
- A prompt tweak causes the agent to favor multi-step chains instead of direct answers
And the results:
- Token usage quietly triples
- Tool costs spike unexpectedly
- Your observability tools show nothing wrong
To fix this, you’ll need visibility into:
- Token consumption per reasoning step
- Retry frequency and trigger conditions
- Decision paths that could’ve been simpler and cheaper
In short, behavior drives cost. And without tracing that behavior, you’re left guessing why the bill grew.
Make Agent Behavior Observable with OTel and Last9
With LLM agents, you need decision-level visibility: what the agent did, why it did it, and where it stumbled. This is where Last9 helps you.
Your LangChain and LangGraph apps can be instrumented using OpenTelemetry—giving you trace data for agent reasoning, tool calls, and state transitions, all in a standard format without vendor lock-in.
And since Last9 is OpenTelemetry-compatible, you don’t have to worry about picking the “right” backend—it just works.
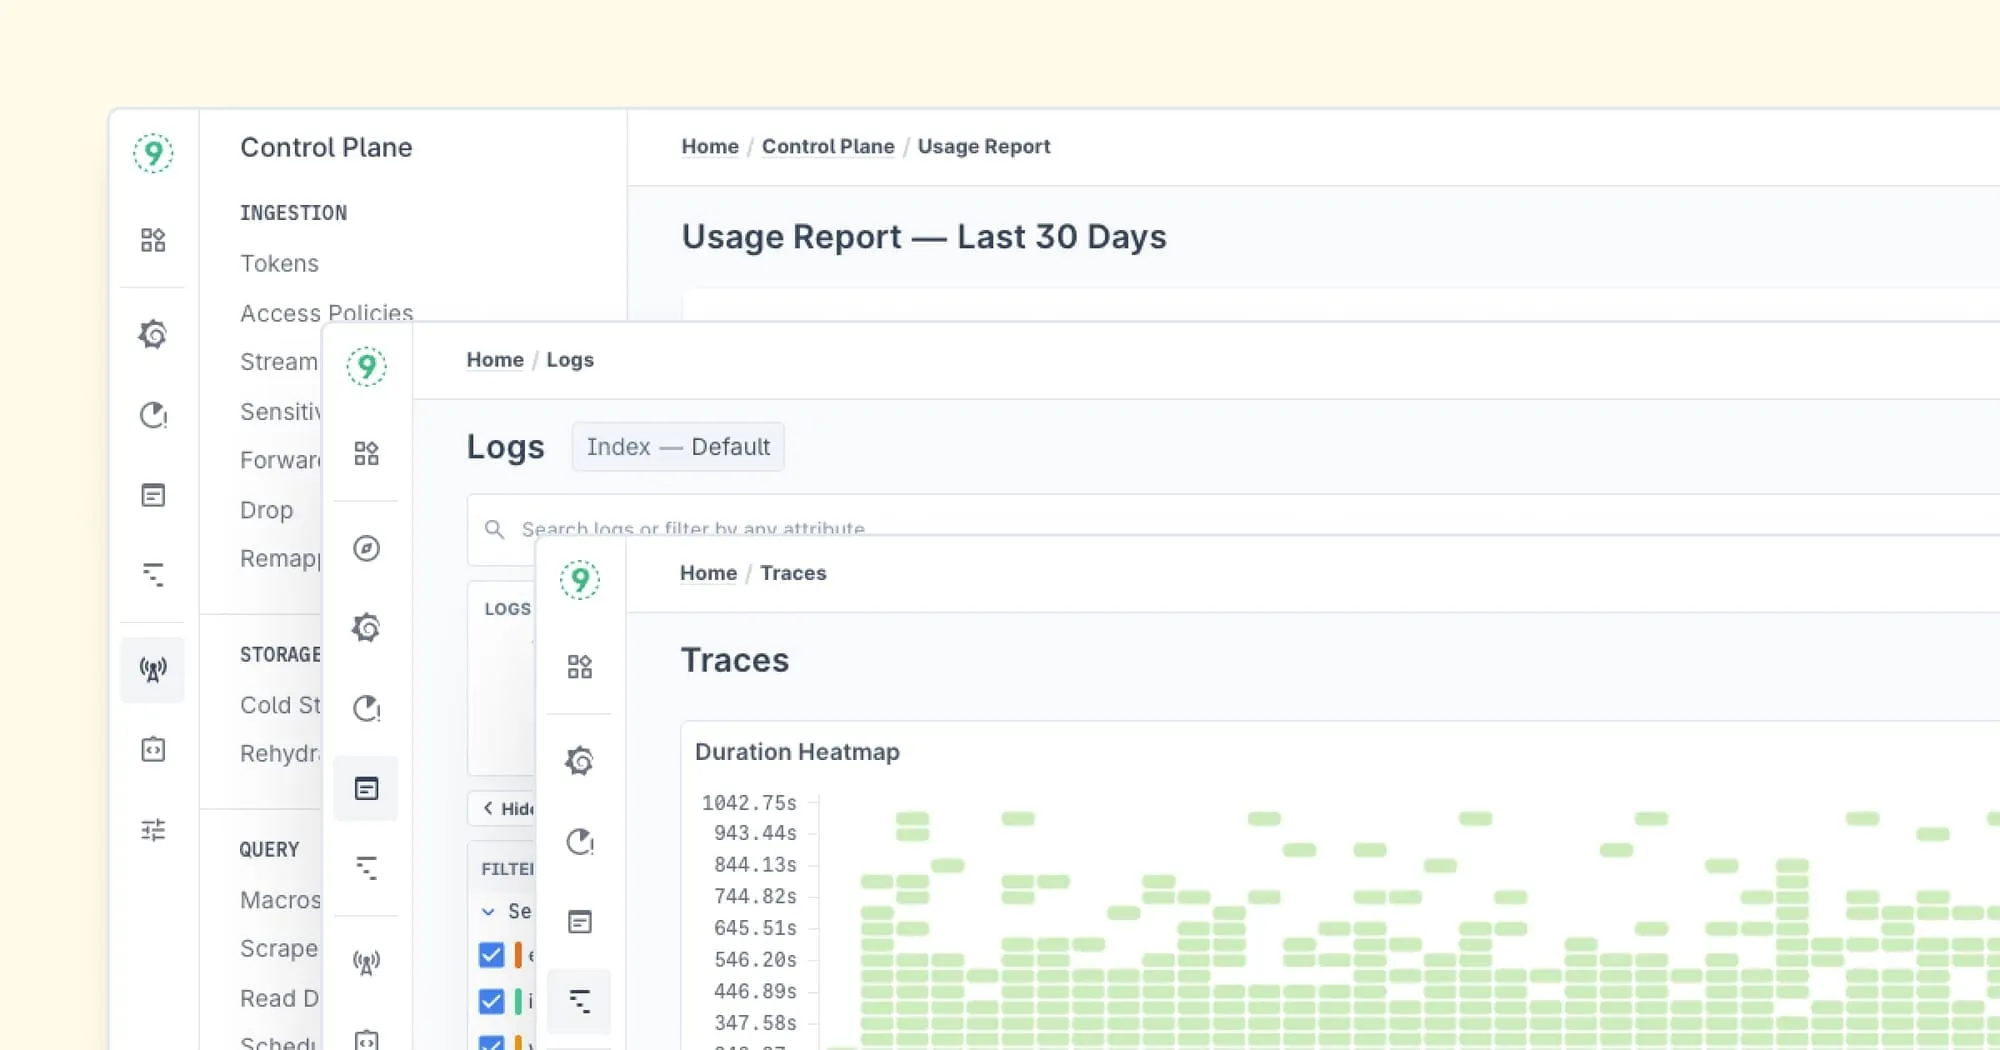
How trace data flows from your app through OpenTelemetry to Last9 for unified monitoring
[Agent Execution] → [OpenTelemetry SDK / Collector] → [Last9 Control Plane] → [Last9 Dashboard]Behind the scenes:
- The agent runs and creates spans for each step.
- OpenTelemetry captures spans and exports them via OTLP—either in-app or via Collector.
- The Collector (optional) batches, enriches, and sends signals to Last9.
- Last9 ingests logs, traces, and metrics—linking them easily in a unified dashboard.
You get:
- Visibility into prompts, tool calls, and intermediate reasoning steps
- Retry, fallback behavior, and node transitions in LangGraph
- Execution metrics aligned with tool usage and trace context
And the best part? You don’t need to change your setup. Last9 works out of the box with OpenTelemetry and Prometheus, and supports over 100 sources—from AWS and Cloudflare to Python, JS, Ruby, and more, with built-in support for LLM systems as well.
Get started with us today!

