If you missed our KubeCon 2024 Day 1 and Day 2 Recaps, you can catch up here!
I’ve shared my experiences and highlighted some of my favorite talks, including insights from Observability Day, Jaeger, Prometheus 2.0, and more.
Day 1

Day 2

A key takeaway from the sessions so far: platform engineering is still a bit of a grey area, with little consensus on what the category should look like. It’s clear that we’re still figuring it out, but the discussions around it have been super engaging!

Another big theme? FinOps and cost management were highlighted in many talks. Cost optimization is becoming a crucial capability in cloud-native environments!
Highlights from Day 3
Here are some talks which I enjoyed at Kubecon NA 2024:
Lessons Learned Adopting OpenTelemetry at Scale - Alex Arnell, Heroku / Salesforce
The talk covered Heroku’s OpenTelemetry journey, highlighting the challenges of adoption in a legacy system, overcoming resistance, and lessons learned from missteps. Alex offered a practical look at implementing OpenTelemetry in complex environments.
Cognitive and Self-Adaptive System for Effective Distributed-Tracing in Applications - Mitul Tandon & Akash Gusain
Mitul and Akash covered a Machine Learning solution to improve trace capture in dynamic API systems. Unlike traditional methods that focus mainly on normal traces, this self-learning system captures a broader range of traces, which helps diagnose API issues more effectively.
Adjusting the sampling rate automatically cuts down on manual configuration, reduces MTTR, and makes trace analysis more efficient. This approach improves operational reliability while also lowering infrastructure costs.
Low-Overhead, Zero-Instrumentation, Continuous Profiling for OpenTelemetry - Christos Kalkanis, Elastic
The talk was all about Elastic’s donation of its eBPF-based continuous profiling agent to OpenTelemetry. It focused on the powerful visibility this agent provides into application runtime behavior, spanning from the kernel to userspace and higher-level runtimes.
Christos highlighted how this approach improves performance tracking, reduces wasteful computations, and speeds up debugging. It also covered the integration of the profiling agent with OpenTelemetry’s OTLP and Collector, as well as how it compares to traditional application instrumentation methods.
Do check once the recording is out!
Measuring All the Costs with OpenCost Plugins - Alex Meijer, Stackwatch
In this talk, Alex discussed the growth of the CNCF OpenCost project, which is approaching 5,000 stars on GitHub. He covered how OpenCost has expanded from Kubernetes and cloud provider cost monitoring to include OpenCost Plugins, starting with Datadog.
Alex also explained how the open-source FOCUS spec allows users to measure virtually any cost, and demonstrated how a plugin-enabled OpenCost deployment works.
Mastering OpenTelemetry Collector Configuration - Steve Flanders, Cisco
This session focused on configuring the OpenTelemetry Collector. Steve broke down common challenges and shared practical examples to make the process more manageable. The live demos were especially helpful, showcasing how to handle tricky configuration scenarios.
A must-listen for any engineer working with OpenTelemetry.
Now You See Me: Tame MTTR with Real-Time Anomaly Detection - Kruthika Prasanna Simha & Raj Bhensadadia, Apple Inc.
In this session, we took a look at how to spot abnormal app behavior in real-time for cloud-native systems. We've all experienced the frustration of nodes restarting and users being locked out of the app.
Kruthika and Raj showed us how to use statistical and machine learning techniques on Prometheus data to catch issues early.

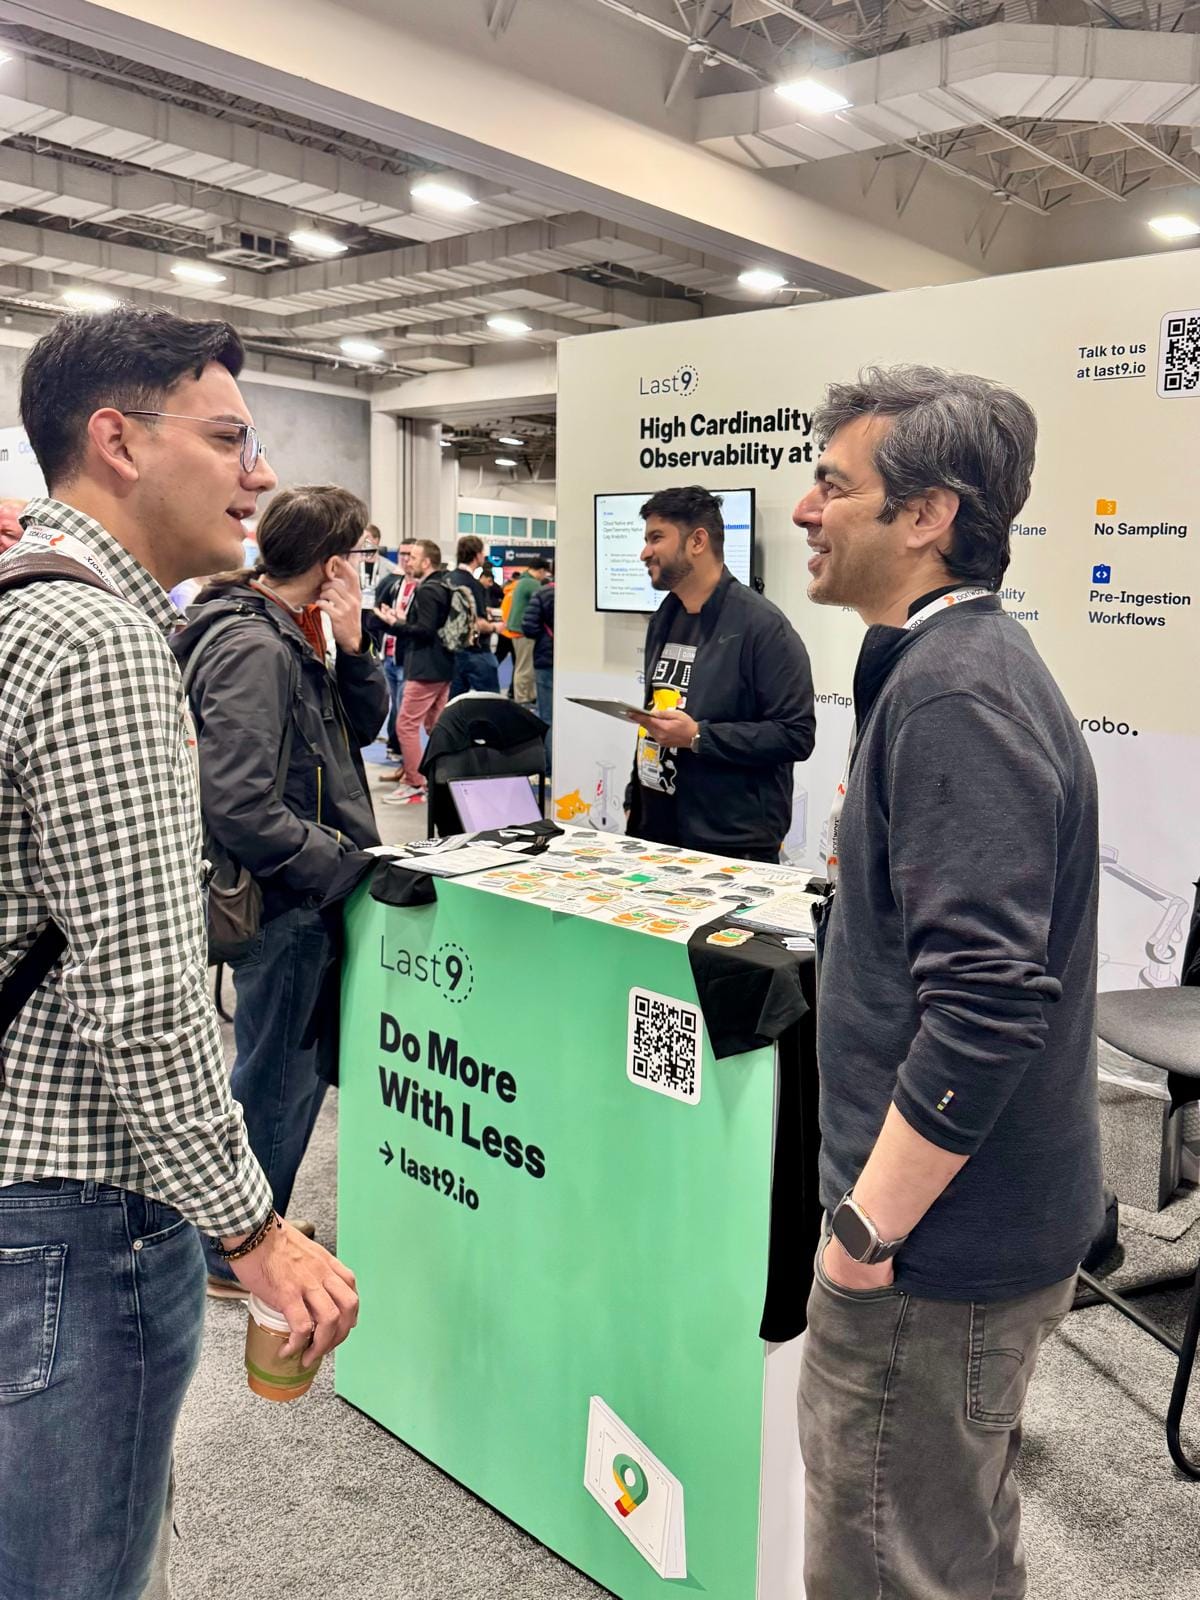
Thanks so much for the love on our stickers and t-shirts! We’re happy they vibe with your work style. Come find us and grab yours!
Keep an eye out for all talks on the CNCF YouTube Channel once they're available. It’s been great meeting everyone here, and I’m looking forward to the last day of KubeCon + CloudNativeCon 2024!


