If you’re into Kubernetes and cloud-native, you probably know that KubeCon + CloudNativeCon is the place to connect with other devs and learn a ton about the space.
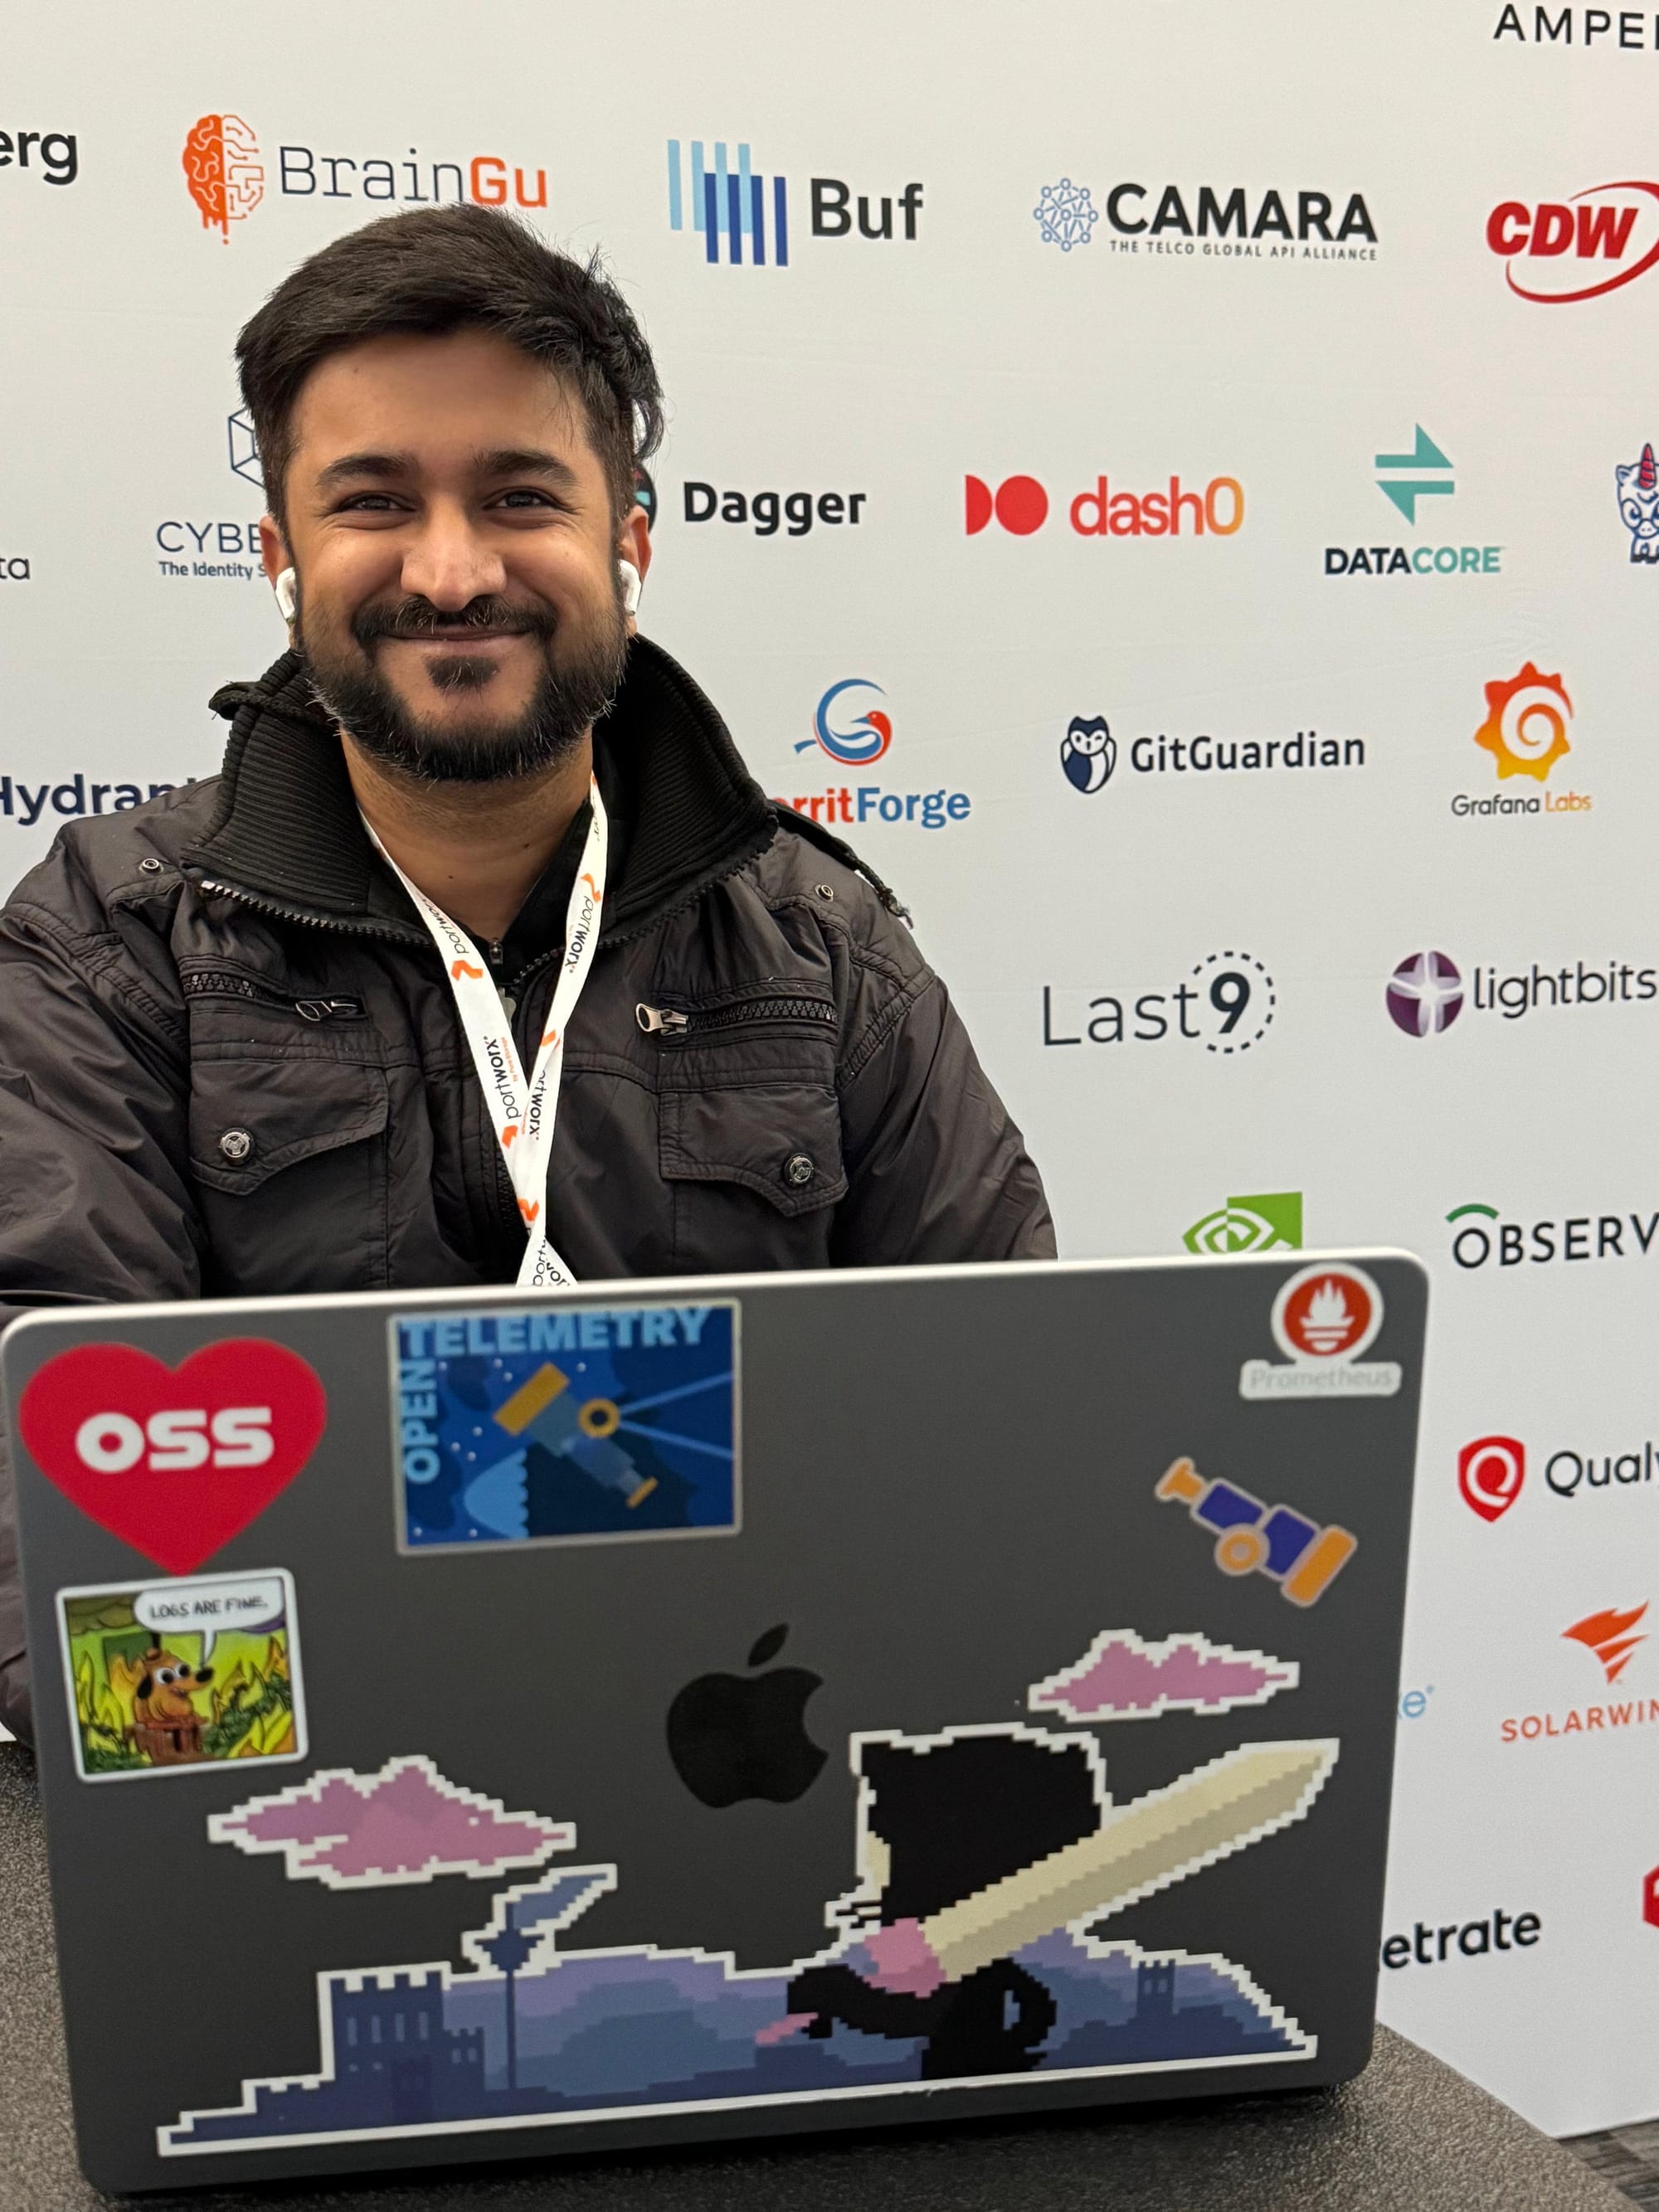
This year, I was in Salt Lake City with my team and was looking forward to catching up with familiar faces and getting some fresh ideas.
If you happen to miss our list of must-attend events and activities at KubeCon 2024, you can catch up here. We’ve covered everything from the latest updates to some cool spots to check out between sessions.
Observability Day
One big highlight for me was Observability Day. I've been working in observability for a few years, so I was really excited to be here. The hallway talks were full of energy, especially around how to better correlate data and bring everything into a single view.
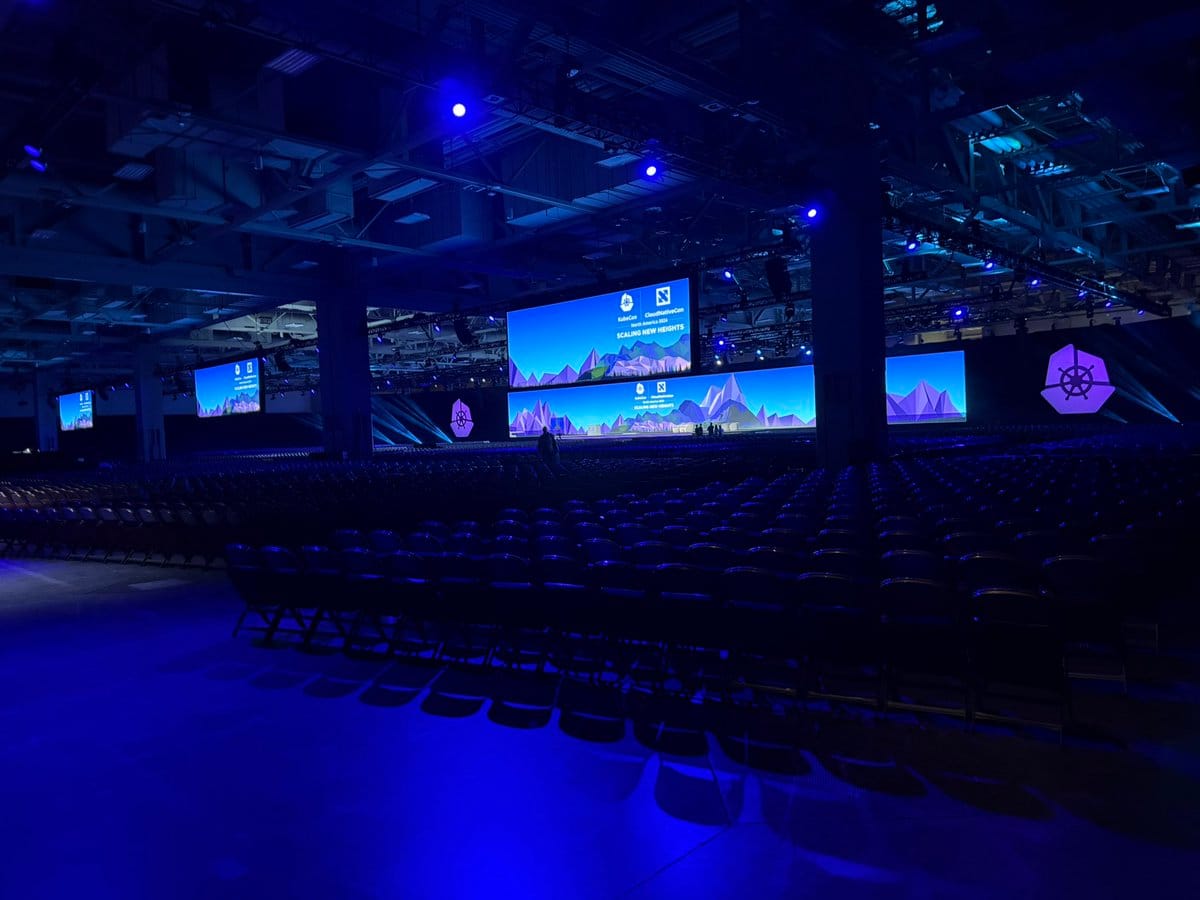
Highlights from Observability Day
Here are some of the talks I loved:
The day kicked off with opening remarks from Program Co-Chairs Anna Kapuscinska, Austin Parker, and Eduardo Silva. They set the stage for a day packed with great insights and conversations around cloud-native observability
Observability Projects Updates - Project Maintainers
Next up was a session with project maintainers sharing updates on their projects. It was refreshing to see what’s on the horizon and how things are progressing in the observability space.
Jaeger: Distributed Tracing with Jaeger and OpenTelemetry | Project Lightning Talk
The session focused on project updates, with a lot of attention on Jaeger's future. The team shared insights into the upcoming V2 release and how it will further integrate with the OpenTelemetry project.
But Wait! There's...Still More‽ - Observability Data Volumes and Strategies for Managing Them - Éamon Ryan, Grafana Labs
I enjoyed Éamon Ryan’s talk from Grafana Labs on the Observability Data Volumes and Strategies for Managing Them.
One point that resonated with me was how, as we add more observability signals and insights to the software we build, the data grows exponentially. And with that growth comes the challenge of processing, storing, and retrieving all that data—putting more strain on the systems that manage it and driving up costs in infrastructure, people, and beyond.
We totally understand this challenge, which is why we built Last9—an OpenTelemetry and Prometheus-compatible data warehouse designed to handle high cardinality and bring together metrics, logs, and traces on a single platform.
When Things Go Sideways: Troubleshooting the OTel Operator - Adriana Villela, ServiceNow Cloud Observability & Reese Lee, New Relic
We all know the OpenTelemetry (OTel) Operator is a handy tool that makes managing OTel in your Kubernetes cluster a lot easier.
Adriana and Reese walked us through common issues like installation hiccups, auto-instrumentation problems, and Collector deployment issues—and, more importantly, how to fix them.
Panel: OpenTelemetry: Bridging Platform and Enablement - Daniel Gomez Blanco, Skyscanner; Ariel Valentin, GitHub; Hazel Weakly, Hachyderm; Suman Karumuri, Airbnb; Vijay Samuel, eBay
This was one of the most exciting panels I attended featured leaders from organizations at the forefront of the OpenTelemetry field. They shared their experiences in building platforms, tools, enablement materials, and team structures that help scale the adoption of OpenTelemetry best practices with minimal friction.
The Road to Observability Everywhere at Monday.Com - David Gohberg, monday.com
The team at monday.com has experienced impressive growth over the past four years, with a strong focus on enabling tracing and observability across their distributed app. However, one challenge they faced was the lack of robust end-to-end tests.
To address this, they integrated OpenTelemetry tracing into their end-to-end testing process, staying true to their 'Observability Everywhere' mantra.
What made their approach stand out was its impact: It improved their feedback cycle by 50%, uncovered issues traditional tests missed, and reduced test creation time by 90%.
Other Exciting Talks
Sponsored Keynote: Make Workloads, Not Infrastructure - Will Stewart, Northflank
In this talk, Will covered some practical strategies for implementing this shift with Kubernetes and the benefits of workload-centric operations, such as consistency and portability across clouds.
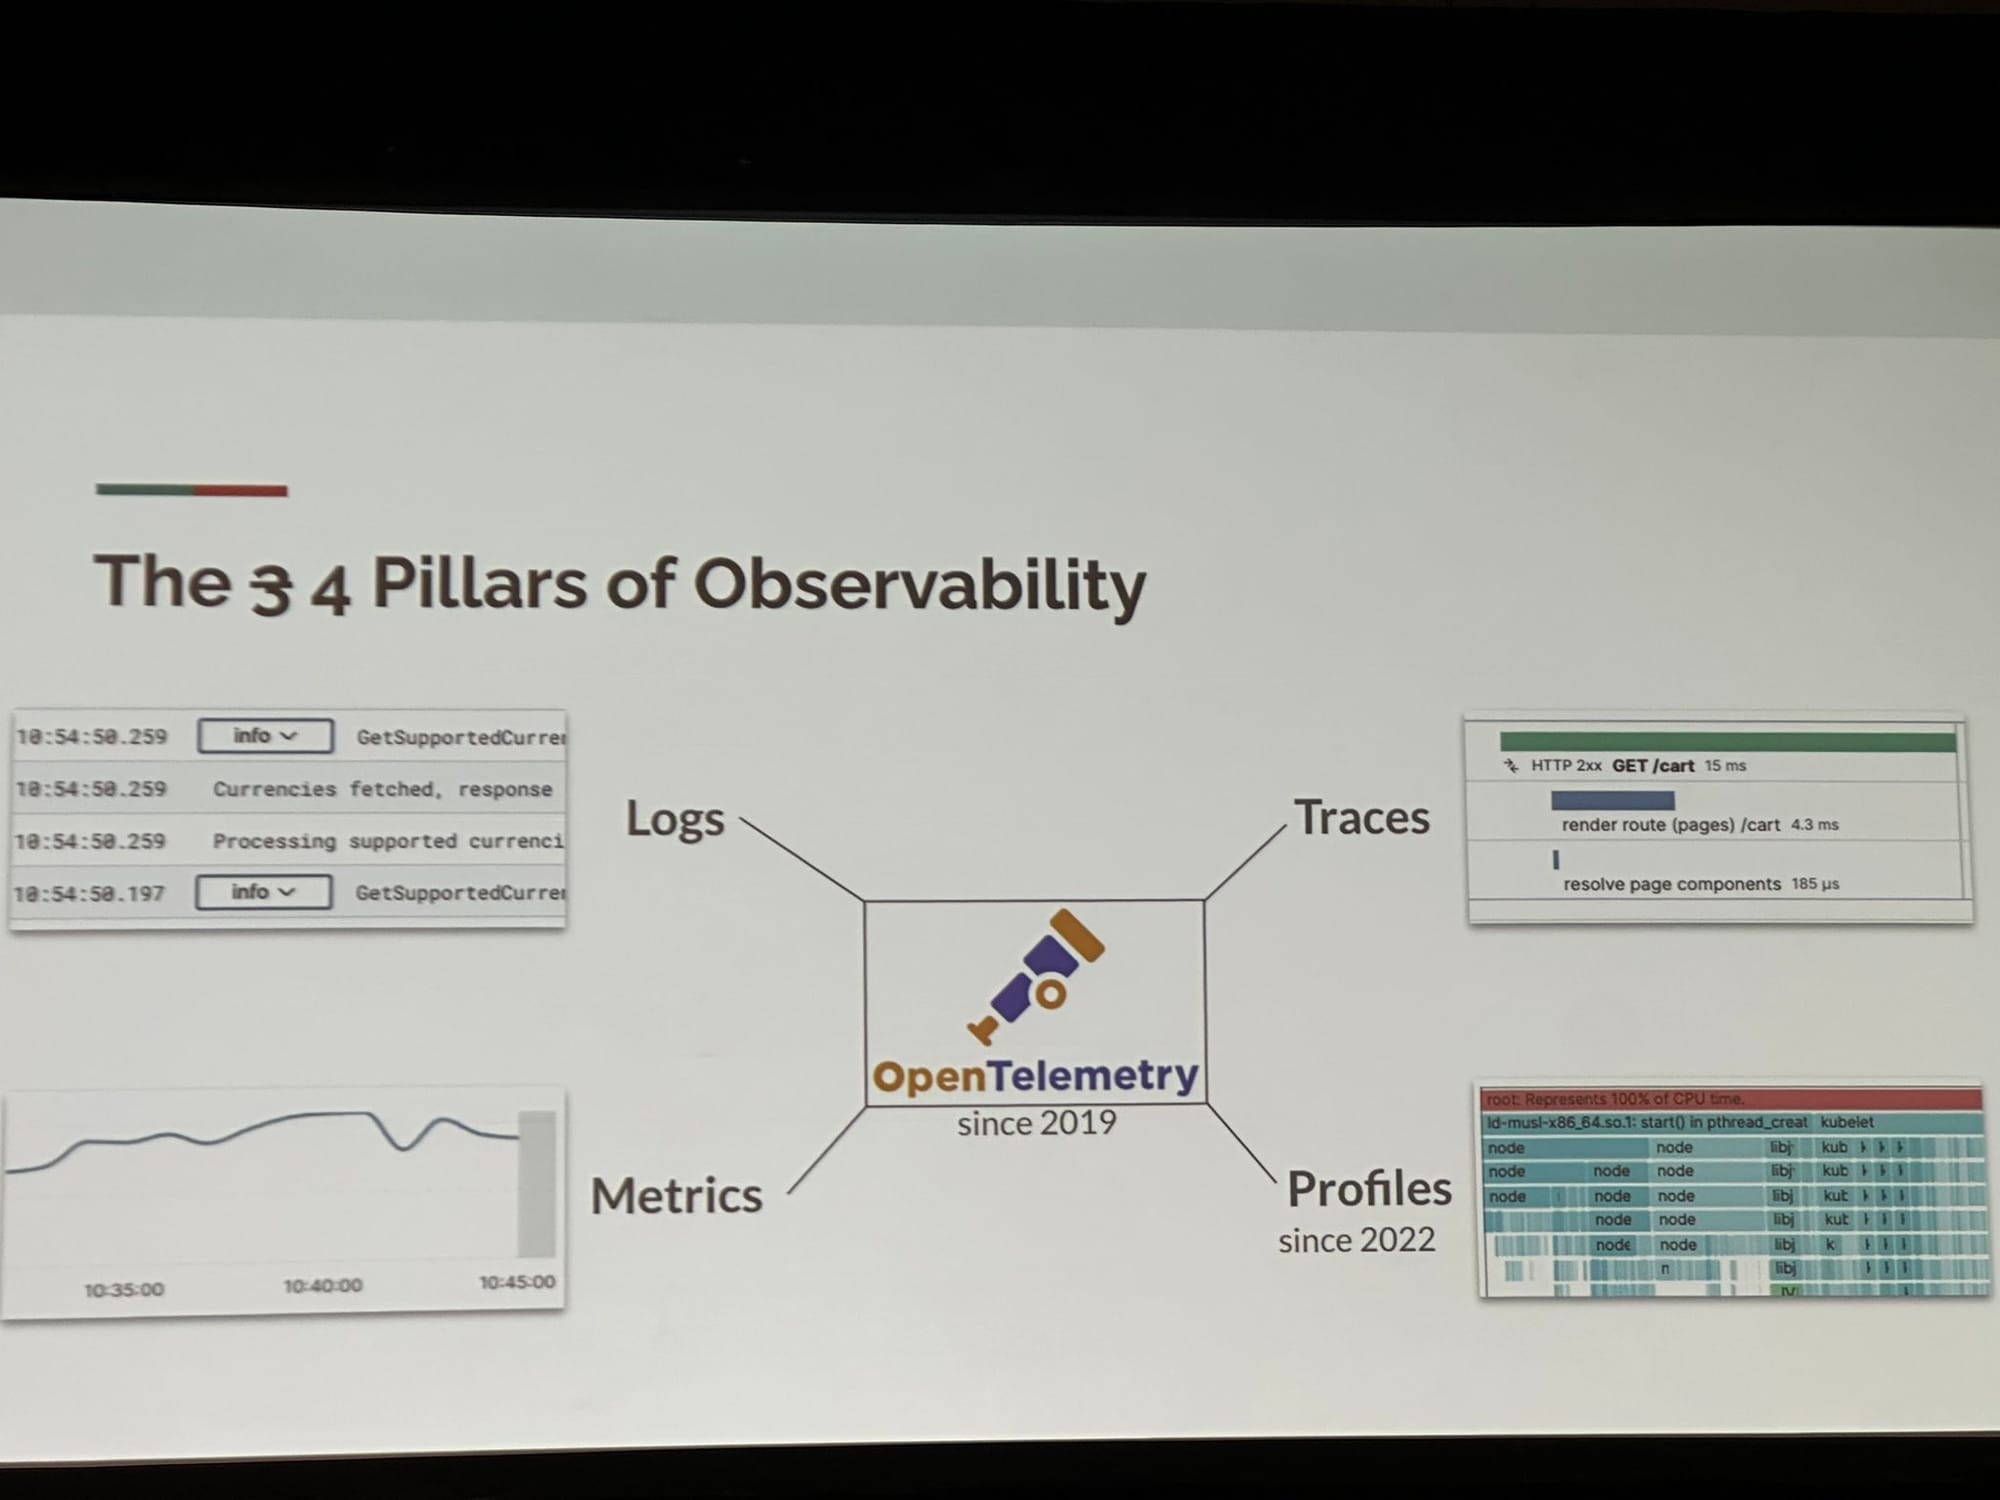
Why Does Continuous Profiling Matter to Developers? - Jonas Kunz, Elastic & Mauricio Salatino, DiagridSalt Palace | Level 1 | 151 G
The talk focused on OpenTelemetry and the "four pillars of observability": metrics, logs, traces, and profiles.
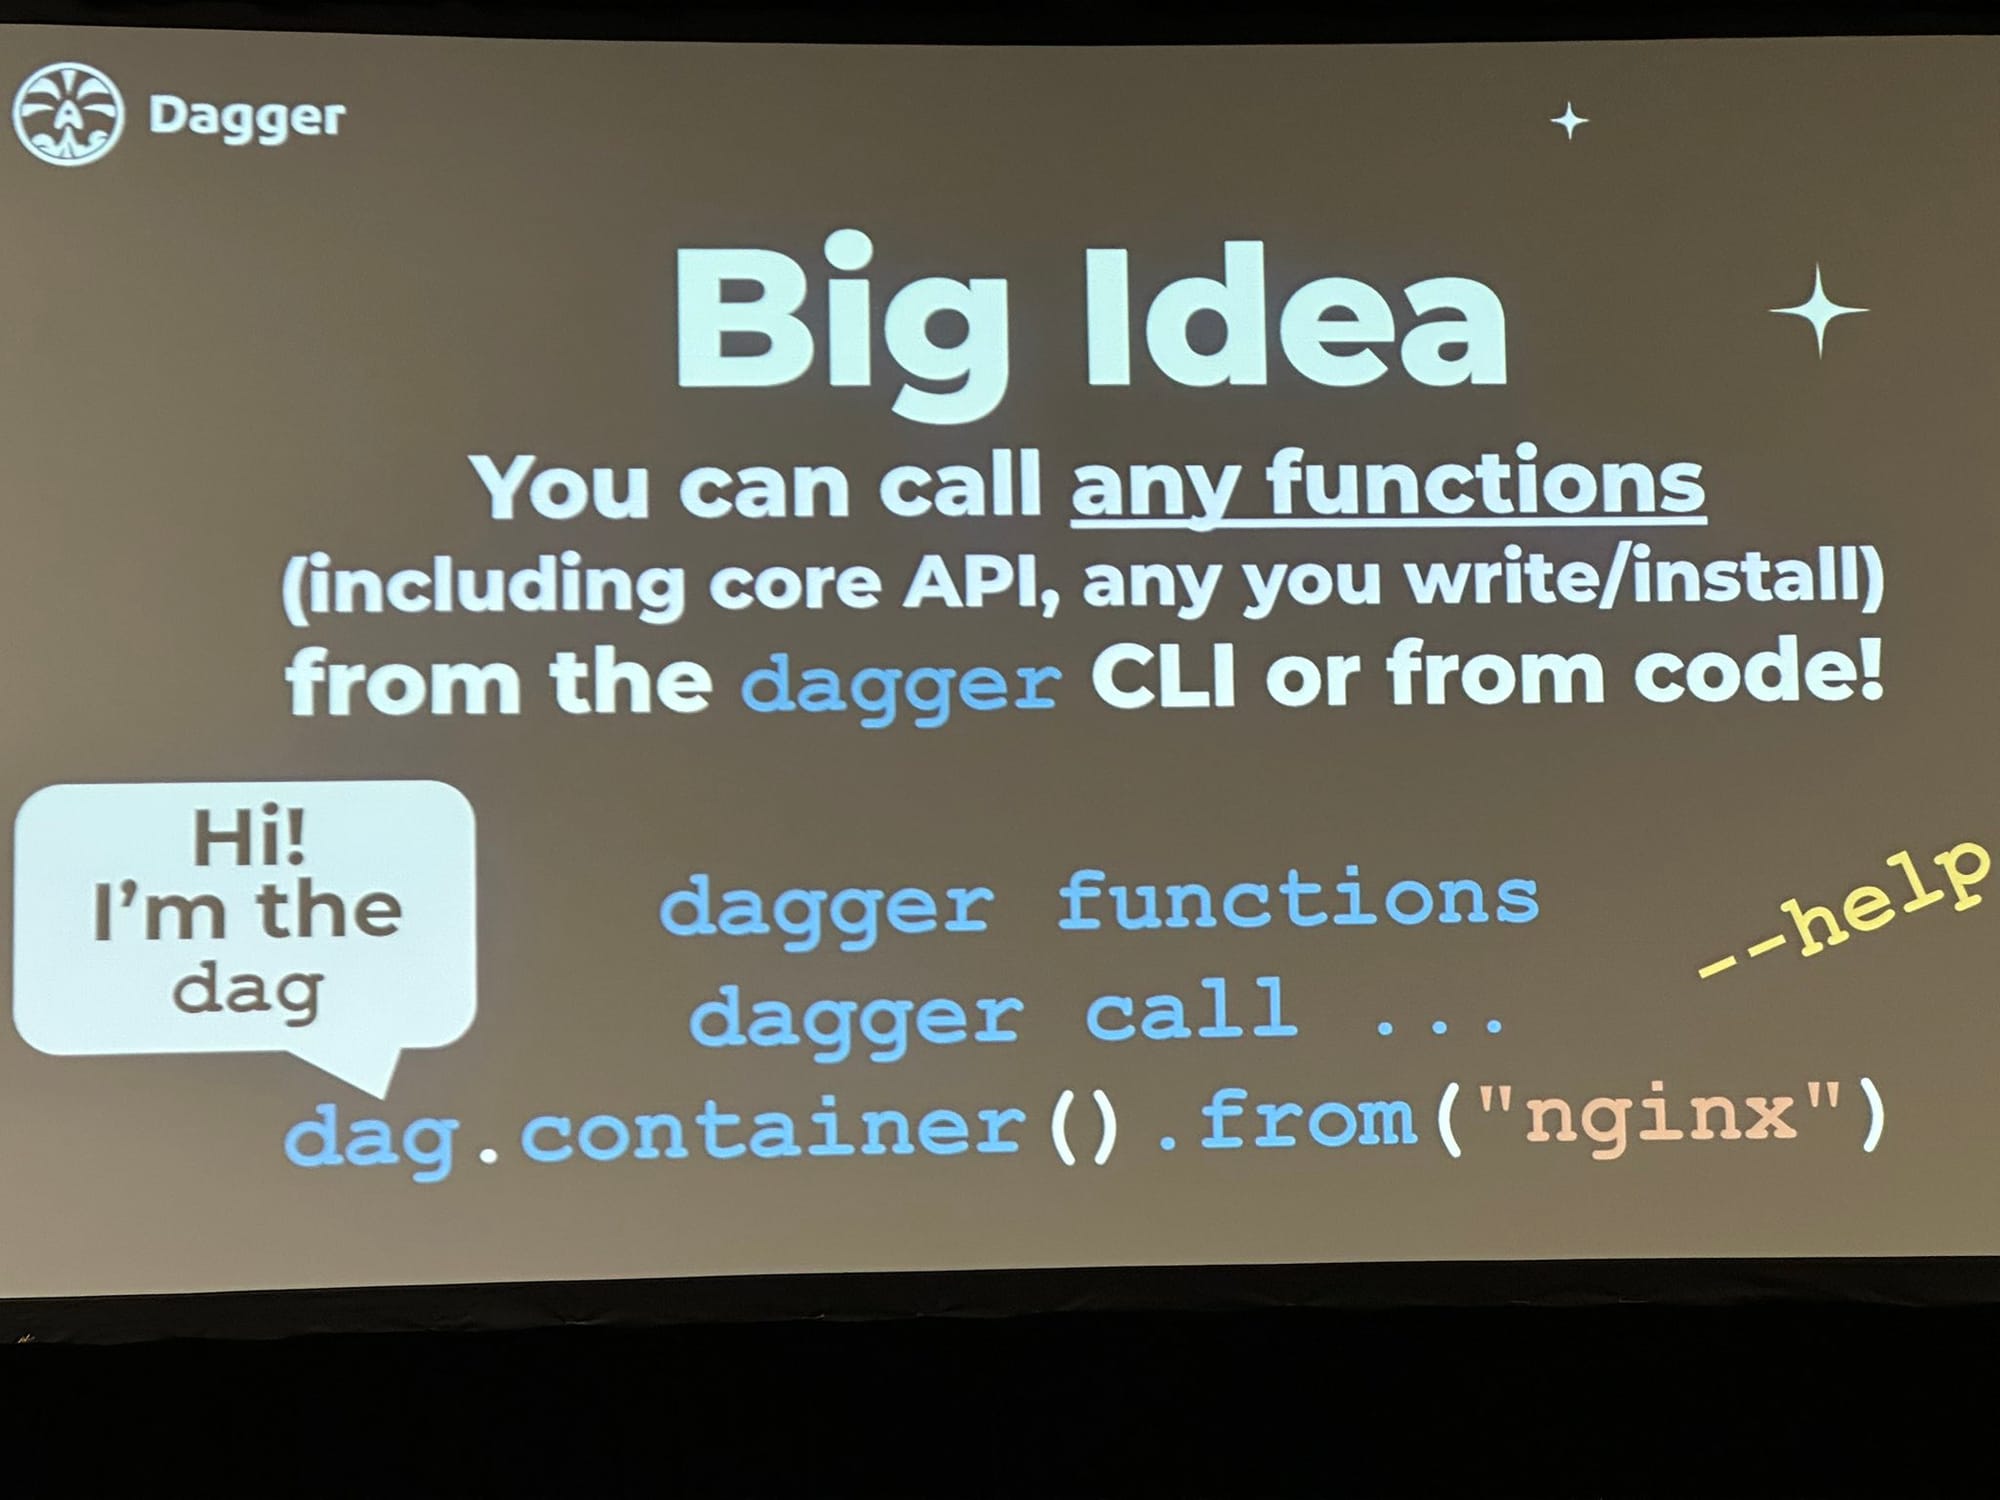
Introducing Dagger Modules: Open Source CI/CD Building Blocks You Already Know How to Write - Jeremy Adams, DaggerSalt Palace | Level 1 | 151 G
A programmable tool that replaces custom scripts with a modern API and flexible, cross-language scripting engine, making automation smoother and more efficient.
The day was packed with exciting talks, and I particularly enjoyed the OpenTelemetry-related sessions and panel discussions. Be sure to check them out when they’re available on the CNCF YouTube Channel.
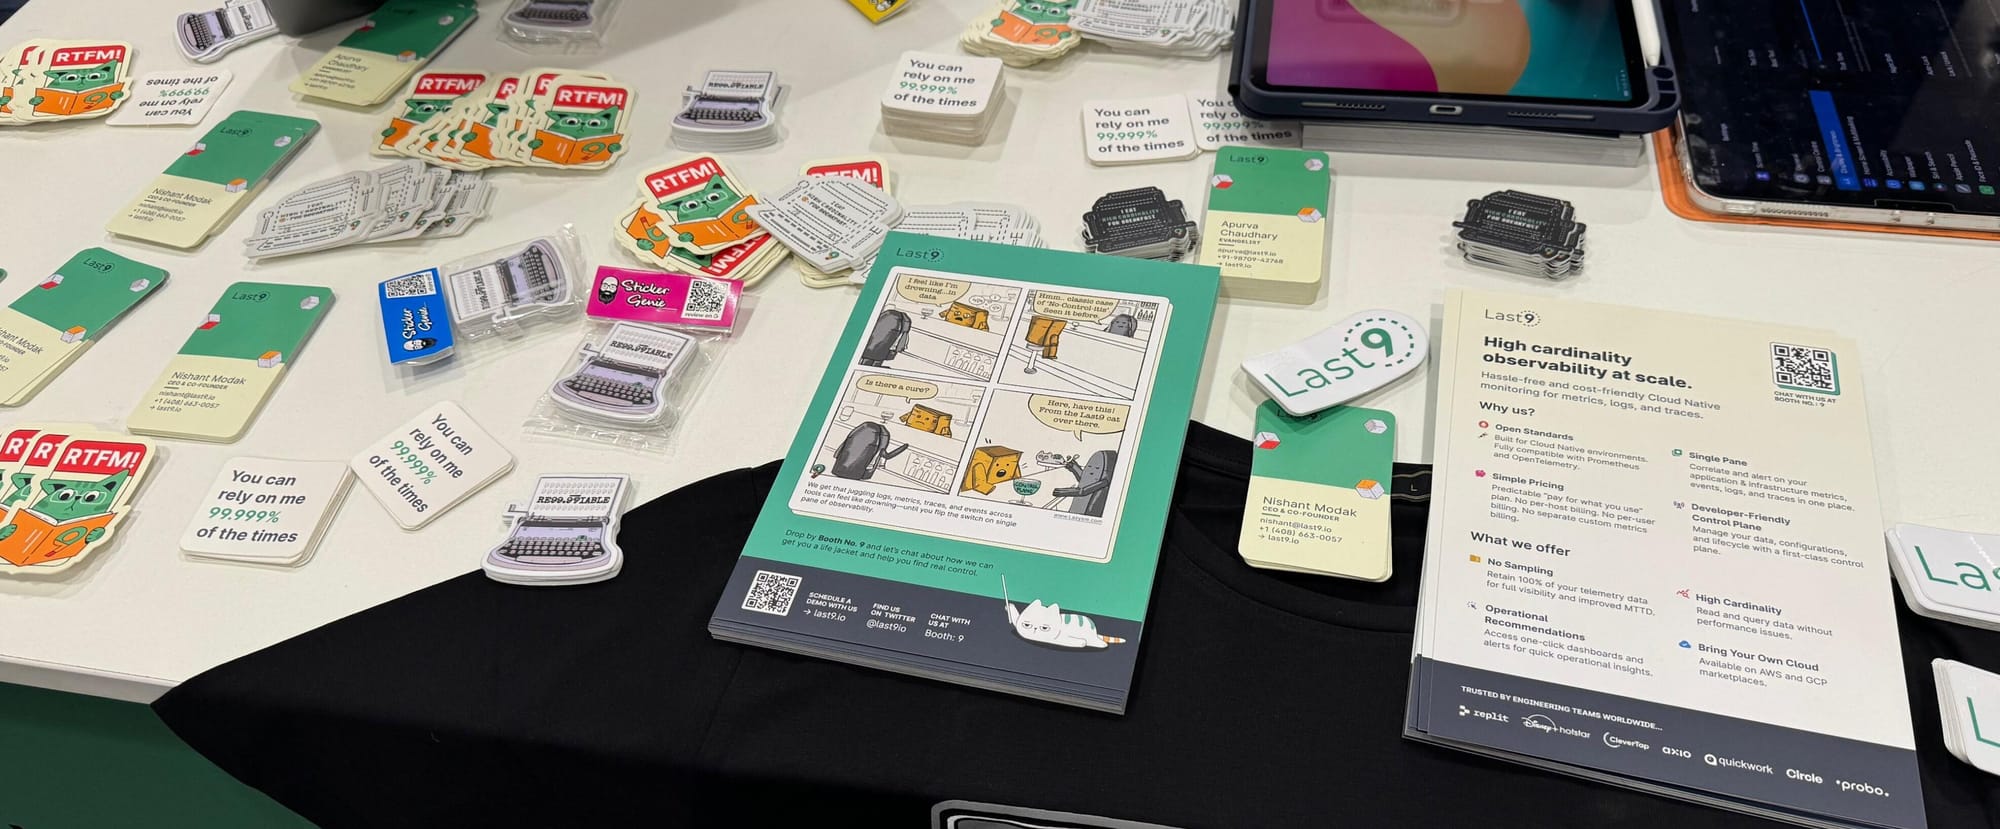
Did you grab our fun merch yet? We’ve got stickers and t-shirts that totally match your work vibes. Find us and snag yours!
I’m already looking forward to Day 2 of KubeCon + CloudNativeCon 2024!
