

If you're running Apache Kafka in production, you know how crucial it is to monitor performance, detect bottlenecks, and troubleshoot issues before they escalate. But with so many Kafka monitoring tools out there, how do you choose the right one?
This guide will break down everything you need to know about Kafka monitoring: why it matters, key metrics to track, and a deep dive into the best tools available.
Why Kafka Monitoring Matters
Kafka is a distributed system designed to handle high-throughput messaging, but it comes with challenges:
- Performance bottlenecks can slow down data pipelines.
- Unhealthy brokers can lead to partition under-replication.
- Consumer lag can impact real-time processing.
- Misconfigured retention policies can cause data loss.
A solid monitoring setup helps you detect and fix these issues before they impact your application.
5 Key Kafka Metrics to Monitor
Before jumping into tools, let’s talk about what you should monitor in Kafka.
1. Broker Health
- CPU and memory usage – High resource consumption can indicate an overloaded broker.
- Disk usage – Ensure brokers don’t run out of space, especially with large retention periods.
- Garbage collection (GC) pauses – Excessive GC can slow down Kafka processes.
2. Cluster Performance
- Throughput (messages/sec, bytes/sec) – Monitor how much data Kafka is processing.
- Replication lag – Delayed replicas can cause data inconsistencies.
- Request latency – High latencies indicate slow Kafka operations.
3. Consumer Health
- Consumer lag – If lag increases, consumers aren’t keeping up with producers.
- Partition assignment – Ensure consumers are evenly distributed across partitions.
4. Producer Performance
- Message production rate – Identify patterns and spikes in message publishing.
- Failed messages – High failure rates may indicate network or broker issues.
5. ZooKeeper Monitoring
- Session count – A high number of sessions could indicate an issue with connections.
- Request latency – Slow ZooKeeper responses can affect broker coordination.
13 Best Kafka Monitoring Tools
Below is a comprehensive comparison of the best Kafka monitoring solutions, detailing their capabilities, strengths, and user feedback.
1. Prometheus & Grafana
Overview:
Prometheus is a widely used open-source monitoring system designed for scalability and flexibility. It collects and processes Kafka metrics using a pull-based model. Grafana, a visualization tool, integrates with Prometheus to create rich, customizable dashboards for real-time Kafka monitoring.
Best Features:
- Efficient Metric Collection: Prometheus scrapes metrics from Kafka exporters, ensuring reliable and accurate monitoring without installing agents.
- Powerful Querying with PromQL: Users can create complex queries to analyze Kafka performance and detect anomalies.
- Customizable Dashboards: Grafana allows users to build highly interactive and visually rich dashboards for Kafka monitoring.
User Feedback:
- Highly flexible and powerful for infrastructure-wide monitoring.
- Requires expertise in PromQL and Grafana configuration, making it difficult for beginners.
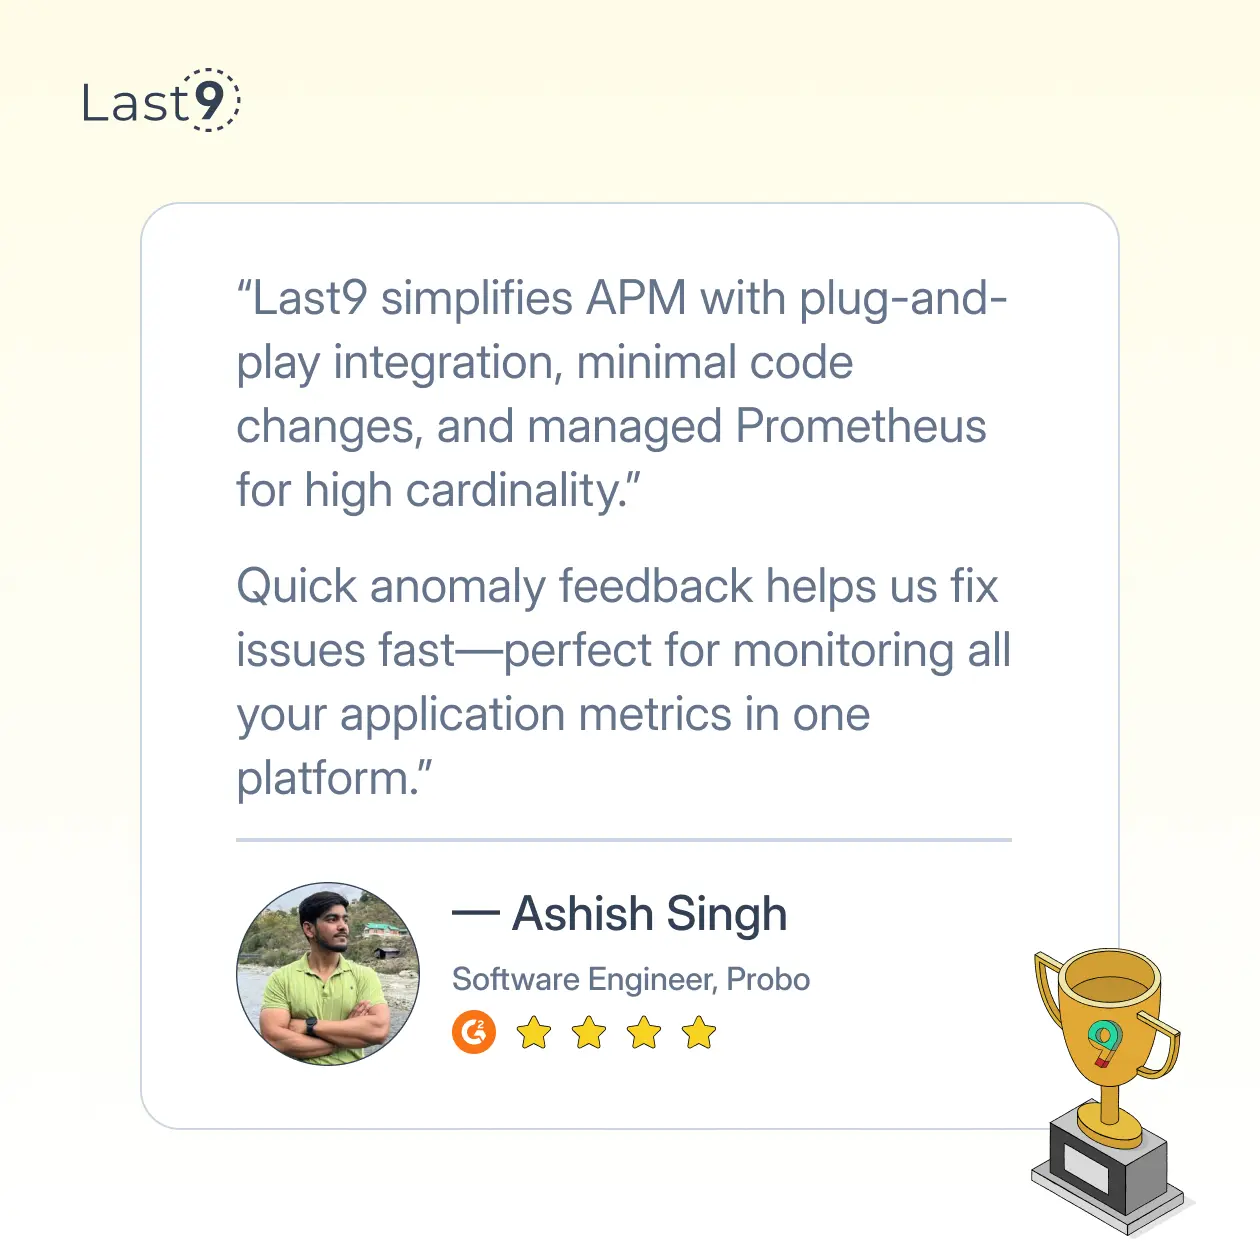
2. Last9
Overview:
Last9 is a cloud-native observability platform designed for scalability, offering real-time anomaly detection and effortless monitoring for Kafka deployments.
Best Features:
- Smart Alerts: Receive timely and accurate alerts with built-in anomaly detection, even for complex data. Integrated with GitOps and IaC for seamless alert management.
- Developer-Friendly: Designed with developers in mind, making data and configuration management straightforward.
- No Data Loss: Retain all telemetry data without sampling, ensuring full visibility for faster troubleshooting.
- Effortless Dashboards: Set up dashboards and alerts with a single click for instant access to key insights.
User Feedback:
- A great choice for modern, cloud-based Kafka deployments.
- Users are happy with easy-to-use dashboards and the best support.
3. Confluent Control Center
Overview:
Confluent Control Center is a native Kafka monitoring solution developed by Confluent. It offers deep visibility into Kafka clusters with real-time monitoring, lag tracking, and alerts.
Best Features:
- Seamless Integration with Confluent Kafka: Works natively with Confluent’s Kafka distribution, making setup and monitoring easier.
- End-to-End Stream Monitoring: Provides detailed insights into the performance of producers, brokers, and consumers.
- Automated Alerts: Detects performance degradation and sends notifications based on predefined thresholds.
User Feedback:
- Offers a seamless and intuitive experience for Confluent users.
- It can be expensive for smaller teams or organizations not using the full Confluent stack.
4. Datadog
Overview:
Datadog is a SaaS-based observability platform that offers automated Kafka monitoring, anomaly detection, and correlation with infrastructure metrics.
Best Features:
- Automated Kafka Metric Discovery: Detects and tracks Kafka brokers, topics, and consumers without manual configuration.
- Infrastructure-Wide Correlation: Links Kafka performance metrics with system-wide infrastructure insights to help with root cause analysis.
- AI-Powered Alerts: Uses machine learning to identify unusual Kafka behavior and potential issues before they escalate.
User Feedback:
- User-friendly interface with robust features for hybrid cloud environments.
- Pricing can become expensive for large-scale Kafka deployments.
5. LinkedIn Burrow
Overview:
LinkedIn Burrow is an open-source Kafka monitoring tool specializing in consumer lag tracking. It focuses on monitoring consumer offsets without requiring modifications to consumer logic.
Best Features:
- Non-Intrusive Consumer Lag Monitoring: Tracks consumer offsets without requiring changes to the application.
- Detailed Consumer Health Insights: Helps detect slow or stuck consumers before they cause major disruptions.
- Scalability: Handles large Kafka clusters efficiently, making it suitable for enterprise deployments.
User Feedback:
- Works exceptionally well for tracking consumer lag in large-scale environments.
- Lacks a built-in user interface, requiring integration with additional visualization tools like Grafana.
6. Splunk
Overview:
Splunk is a premium observability and log management solution that integrates with Kafka to provide real-time event monitoring and machine learning-based anomaly detection.
Best Features:
- Real-Time Log Collection and Analysis: Captures Kafka logs and events instantly for live monitoring.
- Machine Learning-Based Anomaly Detection: Uses AI to detect and alert users about unusual Kafka behavior.
- Customizable Kafka Dashboards: Allows users to create personalized dashboards tailored to their Kafka monitoring needs.
User Feedback:
- Powerful for large enterprises with complex observability requirements.
- It can be costly and may require fine-tuning to optimize for Kafka-specific monitoring.
7. Elastic Stack (ELK: Elasticsearch, Logstash, Kibana)
Overview:
The ELK Stack (Elasticsearch, Logstash, Kibana) is an open-source solution for log aggregation and visualization. It is widely used for capturing Kafka logs and providing real-time insights.
Best Features:
- Centralized Kafka Log Storage: Logstash processes Kafka event logs and stores them in Elasticsearch for easy retrieval.
- Real-Time Visualization: Kibana provides intuitive dashboards to analyze Kafka events and trends.
- Scalable for Large Deployments: Efficiently manages and searches through high volumes of Kafka logs.
User Feedback:
- A great tool for centralized log storage and search.
- Requires careful indexing and optimization to maintain performance with large datasets.
8. Instana
Overview:
Instana is an AI-powered application performance monitoring (APM) tool that automatically detects and monitors Kafka components.
Best Features:
- Automatic Kafka Component Discovery: Instana detects and tracks Kafka topics, brokers, and consumers without manual setup.
- AI-Driven Anomaly Detection: Uses machine learning to identify potential issues before they impact operations.
- Distributed Tracing for Kafka: Helps track end-to-end message flow across Kafka topics.
User Feedback:
- Highly automated, requiring minimal manual setup.
- Some users find the pricing steep compared to other APM solutions.
9. New Relic
Overview:
New Relic is a full-stack observability platform that offers deep insights into Kafka brokers, consumers, and producers.
Best Features:
- Comprehensive Kafka Monitoring: Provides real-time visibility into broker health, consumer lag, and topic performance.
- AI-Powered Alerting: Automatically detects anomalies and performance degradation.
- Customizable Dashboards: Users can configure dashboards to display Kafka metrics relevant to their infrastructure.
User Feedback:
- Strong analytics capabilities with a user-friendly UI.
- Pricing may not be suitable for smaller teams.
10. SemaText
Overview:
SemaText is a cloud-based Kafka monitoring tool that provides deep observability into Kafka brokers, consumers, and producers.
Best Features:
- Pre-Configured Kafka Dashboards: Simplifies setup by providing ready-to-use monitoring dashboards.
- Detailed Performance Metrics: Tracks consumer lag, broker health, and topic trends in real-time.
- Automated Alerts: Notifies users about potential Kafka performance issues.
User Feedback:
- Ideal for teams seeking a Kafka-focused observability tool.
- Some users report a need for more extensive documentation.
How to Choose the Right Kafka Monitoring Tool
The best tool depends on your use case:
- For open-source flexibility: Go with Prometheus & Grafana.
- For enterprise-grade Kafka monitoring: Confluent Control Center or Last9.
- For consumer lag monitoring: LinkedIn Burrow.
- For centralized logging and analysis: ELK Stack or Splunk.
Final Thoughts
With the right metrics and the right tools, you can ensure smooth Kafka operations without unexpected failures.
If you're looking for a cost-effective managed observability solution without compromising performance, try Last9.
Trusted by industry leaders like Probo, Games24x7, CleverTap, and Replit, Last9 is a cutting-edge Telemetry Data Platform that unifies logs, metrics and traces in one place. It seamlessly integrates with OpenTelemetry, Prometheus, and other tools, striking the perfect balance between performance, cost, and user experience.
With our intelligent Control Plane, engineering teams gain real-time metrics, smart alerting, and effortless handling of high-cardinality data, enabling deeper insights into observability and operational intelligence.
Schedule a demo with us to learn more, or start your free trial!

