

Logs are a key part of building and running software, but managing them can get complicated fast. As your apps grow and generate logs from many sources, choosing the right tool to store, search, and analyze those logs becomes important. Graylog and Loki are two popular options, each with a different way of handling logs.
In this blog, we’ll break down the main differences between Graylog and Loki, how they work, and which types of projects they suit best.
What Are Graylog and Loki?
Graylog is a centralized log management platform that’s been helping teams handle logs since 2010. It’s a pretty full-featured system—it collects logs from different sources, indexes their entire content, and makes them searchable.
On top of that, it includes alerting features and customizable dashboards, so you can not only find issues quickly but also visualize trends and get notified when something’s off. It’s designed to be an all-in-one solution, especially if you want a single tool to manage everything around your logs.
Loki takes a different route. Built by Grafana Labs and released in 2018, Loki was made with the idea of being “like Prometheus, but for logs.” Instead of indexing the entire log message, Loki only indexes metadata labels—things like service names, environment tags, or container IDs.
The actual log lines are stored in compressed chunks and searched on demand. This approach means Loki uses far less storage and is generally more cost-efficient, especially if you’re dealing with huge volumes of logs.
The trade-off? Graylog’s full indexing makes searches more flexible and often faster for complex queries, but it comes at the cost of more storage and CPU usage. Loki’s lightweight indexing saves resources but may be slower or less powerful if you need to search inside log messages extensively.
Breaking Down Graylog’s Architecture
Graylog has three main parts that handle your logs.
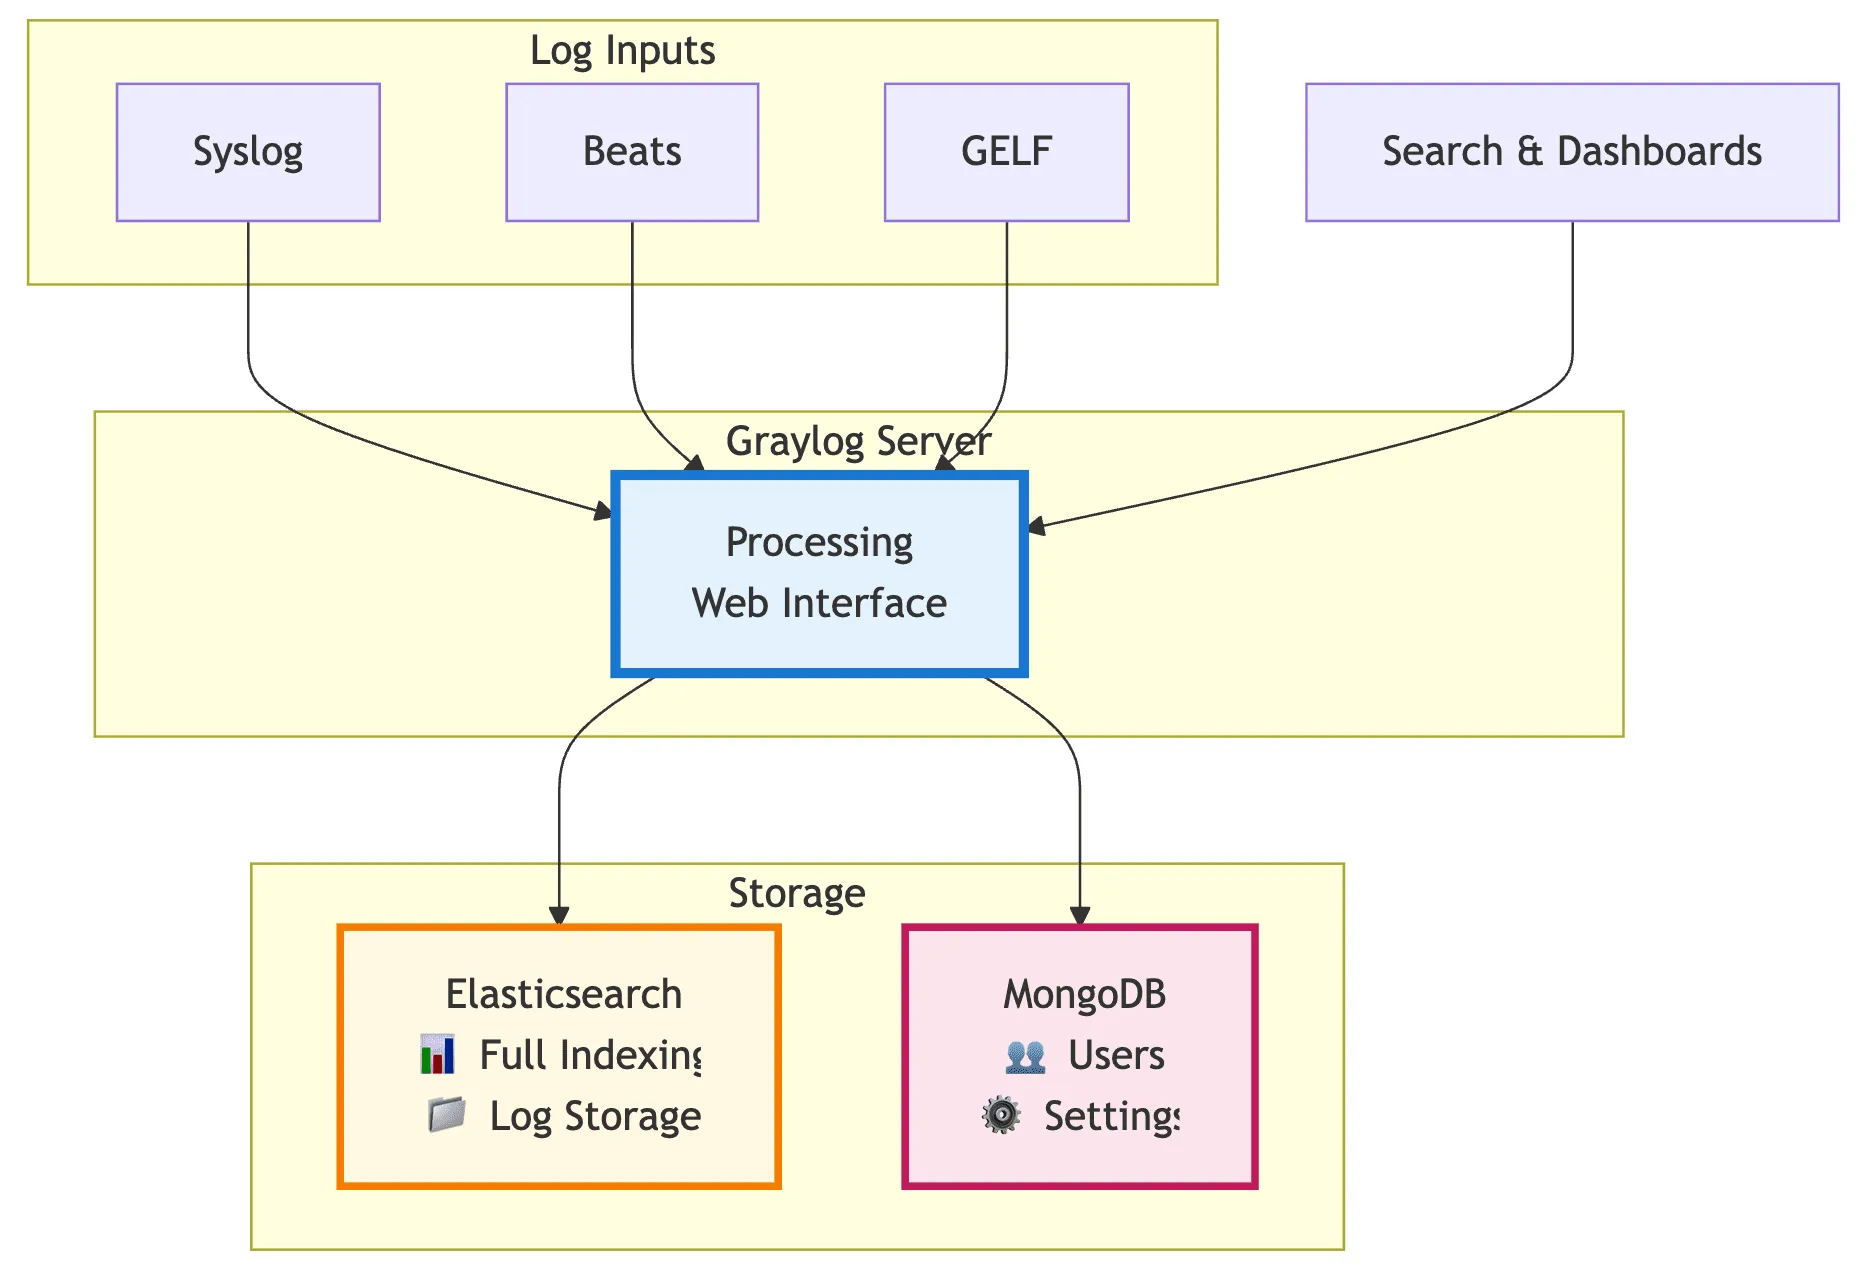
First, the Graylog Server. It gets the logs, processes them, and runs the web interface where you search and check things out. This is where most of the work happens.
Then there’s Elasticsearch. This is where all your logs live and get fully indexed. That means you can search any detail in any log, but it also means the more logs you have, the more storage and resources you’ll need.
Lastly, MongoDB holds the system info — user accounts, settings, and stuff like that. It’s separate from the actual logs. So, Graylog makes it easy to search logs in detail, but that comes with higher storage and resource use as you scale.
If you’re interested in how Loki vs Prometheus compare for metrics and logs, check out our detailed comparison!
How Loki Handles Logs
Loki keeps things pretty simple with just two main parts.
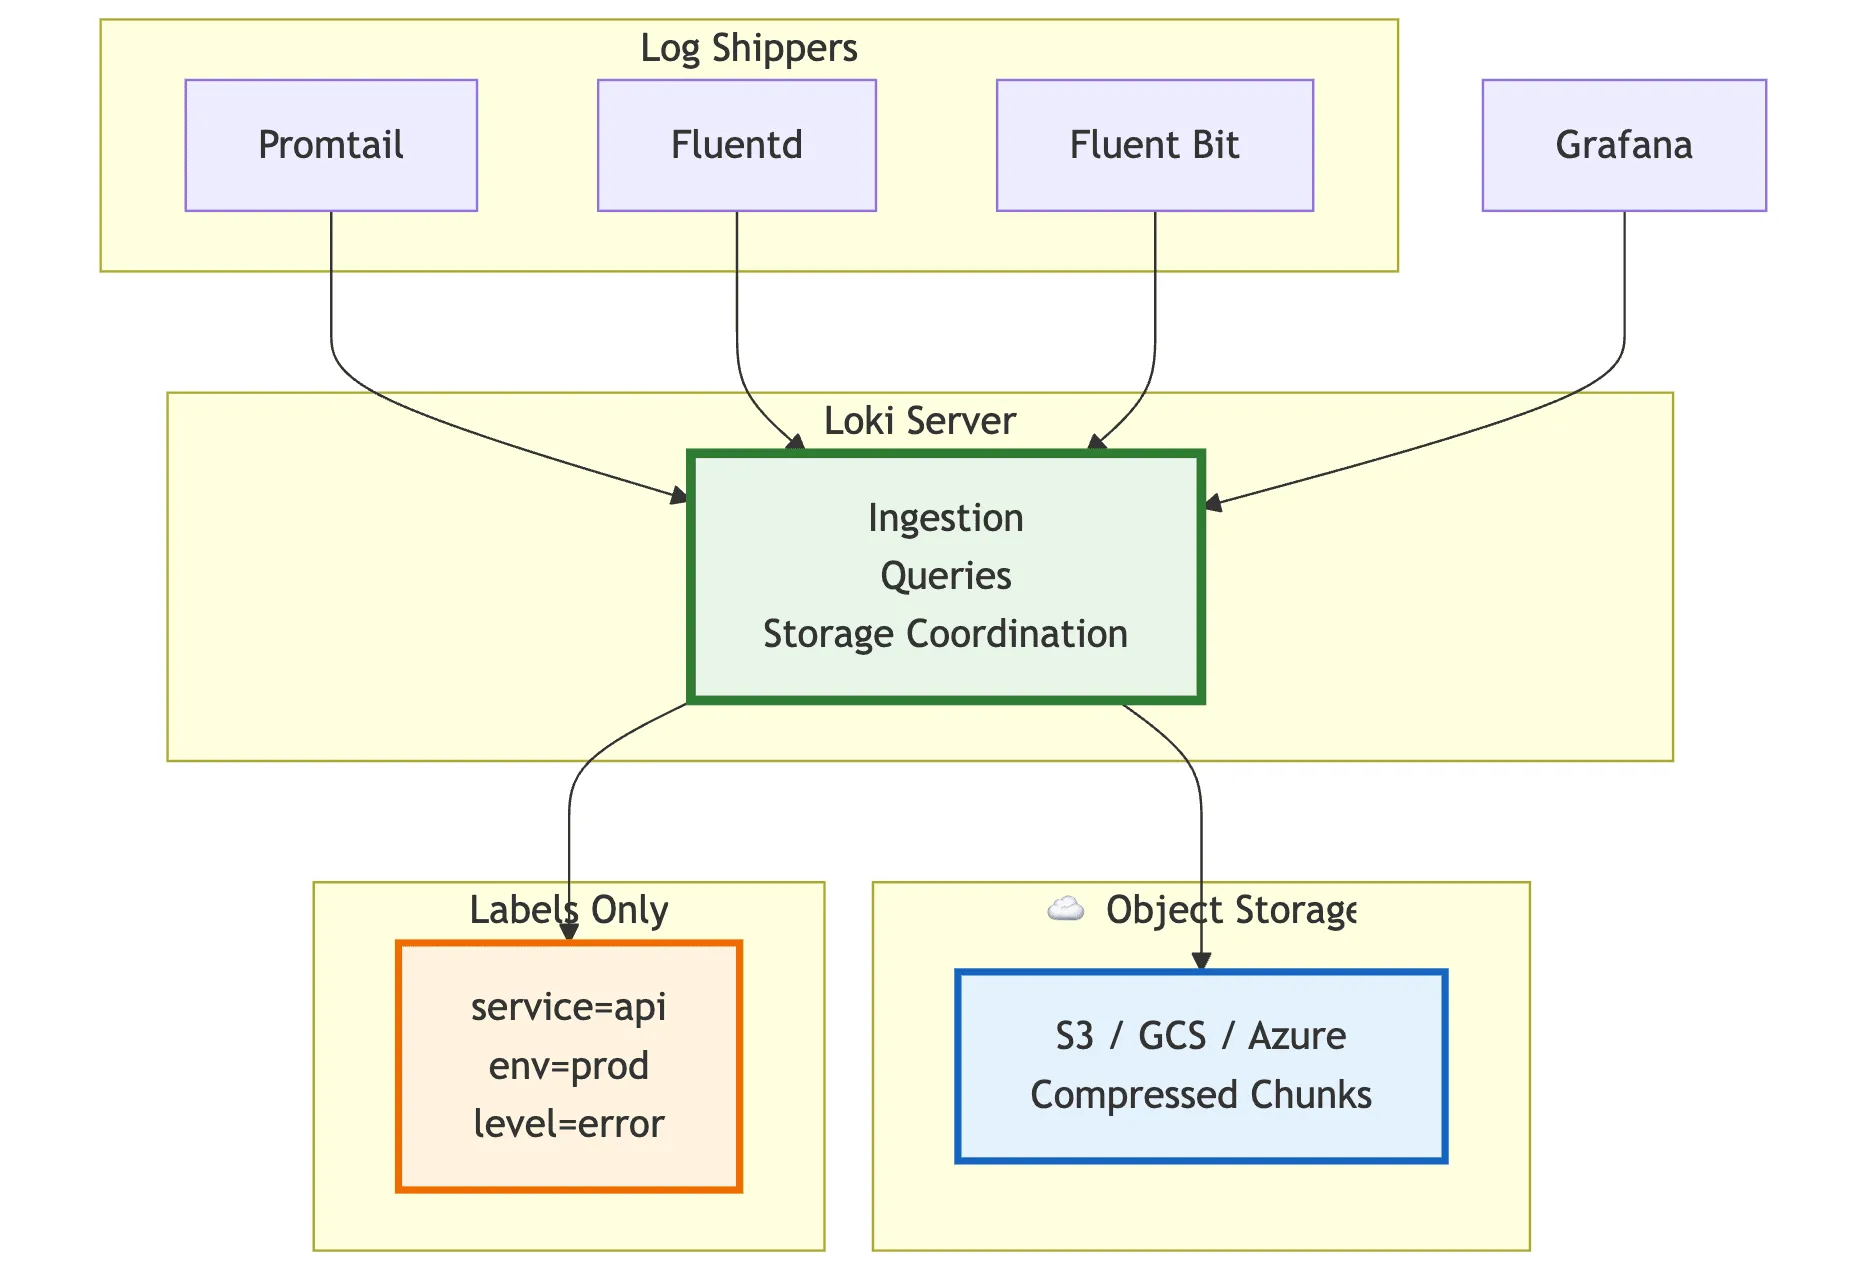
There’s the Loki Server, which takes care of getting logs in, running queries, and managing storage. It’s built to scale out easily, so adding more servers as you grow is no hassle.
For storing the logs themselves, Loki uses object storage like S3 or Google Cloud Storage. Instead of indexing every log line, it stores logs in compressed chunks, which helps keep storage costs low.
The key idea with Loki is that it only indexes labels—things like service name, environment, or log level—not the full log content. That makes it lightweight and efficient, but you need to be careful about how you tag your logs to get the most out of it.
Query Speed: What to Expect from Graylog and Loki
Graylog is great when you need to run quick, detailed searches. Say you want to find every log mentioning “database timeout” from the past week—Graylog can pull that up fast because it indexes everything.
Loki is built to zoom through queries based on labels. If you want logs from a particular service or a specific time window, Loki’s usually very fast. But if you’re trying to do a full-text search through all log messages, especially over a big period, it can be slower.
For example, when debugging a single microservice, Loki’s label filtering makes it easy to narrow down just that service’s logs. But if you’re trying to find a specific error message across your entire system, Graylog’s full-text indexing will get you there quicker.

How Storage Costs Compare Between Graylog and Loki
This is one of the biggest differences between Graylog and Loki. Loki’s storage approach is much lighter, often around 10 times more efficient than traditional logging tools.
Why? Loki stores logs in compressed chunks and only indexes the labels, not the full log content. That means if you’re dealing with a million log lines, Loki might use just 2 to 5 GB of storage. Graylog, on the other hand, could easily use 20 to 50 GB for the same amount of data because it indexes everything.
Here’s a quick comparison to put things in perspective:
| Aspect | Graylog | Loki |
|---|---|---|
| Storage per 1 million logs | 20–50 GB | 2–5 GB |
| Query speed (indexed fields) | Instant | Fast |
| Query speed (full-text) | Instant | Moderate |
| Memory usage | High | Low |
So if storage cost or efficiency is a big concern, Loki’s design can be a real advantage.
For a practical guide on setting up Loki for log management, including how it works, how to query, and what to watch out for in practical environments, check out our Getting Started with Loki for Log Management article.
How Easy Are They to Use?
Getting Started With Graylog
Graylog comes with a ready-to-go web interface that most developers find easy to navigate. You can start collecting and searching logs quickly. The platform also supports alerts and dashboards out of the box.
But behind the scenes, Graylog isn’t a single service. You’ll be managing three main components:
- Graylog Server: Processes logs and runs the UI
- Elasticsearch: Stores and indexes your logs
- MongoDB: Keeps configuration and user data
Each needs to be installed, configured, and monitored separately. That means more moving parts to maintain and troubleshoot, especially as your log volume grows. Elasticsearch, in particular, can demand significant resources and tuning.
So while the user interface is straightforward, the operational side requires attention and some setup time.
Setting Up Loki
Loki is simpler to set up because it mainly involves just the Loki server. If you already use Grafana, adding Loki feels natural since it integrates seamlessly.
However, Loki requires upfront planning around labels. Unlike Graylog, where you can search any part of your logs later, Loki only indexes labels you define when sending logs. This means:
- You need to design your label strategy before ingestion
- Searching inside the log content isn’t as flexible
- Getting labels right up front is critical for smooth querying
On the plus side, fewer components mean less to manage and generally lower resource use.
What Does It Cost to Run Graylog and Loki?
Graylog itself is open source and free to use. The costs come from the infrastructure it needs to run smoothly. The biggest expense is usually the Elasticsearch cluster, which can get pricey fast if you’re handling a lot of logs.
Here’s what you need to budget for:
- Running Elasticsearch nodes, which require CPU, memory, and storage
- MongoDB for managing metadata and configurations
- The Graylog server itself, which needs its resources
- Network costs involved in shipping logs between components
If your team processes over 100GB of logs daily, these infrastructure costs can add up to thousands of dollars a month.
Why Loki Usually Costs Less to Operate
Loki keeps operational costs lower by only indexing metadata labels instead of full log content. This makes a big difference:
- Storage needs drop dramatically, often by around 10 times
- Compute power required is much lower
- Object storage like S3 is cheaper than Elasticsearch’s storage demands
- Network traffic is reduced because less data is indexed and moved
For example, a team processing 100GB of logs daily might spend just 20–30% of what they’d pay to run a comparable Graylog setup.
For a comprehensive overview of top application logging tools in 2025, including their features and use cases, check out our Top 11 Application Logging Tools for DevOps Engineers in 2025 article.
How Graylog and Loki Fit Into Your Setup
Graylog Integrations
Graylog comes ready to handle logs from a bunch of common sources right out of the box. It supports:
- Syslog
- GELF (Graylog Extended Log Format)
- Beats (from the Elastic stack)
- Various application-specific log formats
Its alerting system is pretty solid and flexible too. You can create complex alert rules based on log patterns, specific field values, or even statistical thresholds to catch unusual behavior.
Loki Integrations
Loki plays nicely within the Grafana ecosystem. If you’re already using Grafana for metrics, adding Loki gives you a unified place to view logs alongside those metrics.
Popular tools that work well with Loki include:
- Promtail, the official log shipper built for Loki
- Fluentd and Fluent Bit for flexible log collection
- Native integration with Docker and Kubernetes environments
- Grafana itself, for rich visualization and querying
But if you’re building a modern observability stack, Last9 offers budget-friendly managed observability designed to handle high-cardinality data efficiently at scale.
When Should You Pick Graylog or Loki?
When Graylog Is the Better Fit
Graylog works well if:
- You need powerful, flexible searching. If your team often digs through logs without a clear search plan, Graylog’s full-text indexing makes finding what you need easier.
- Compliance and auditing matter. Its mature alerting and reporting features help meet regulatory requirements more smoothly.
- Your team already knows Elasticsearch. If you’re used to the ELK stack, Graylog’s setup will feel familiar.
- Budget isn’t your main concern. You’re okay with higher storage and infrastructure costs in exchange for richer search capabilities.
When Loki Makes More Sense
Loki is a good choice if:
- Saving on storage and compute costs is a priority. Loki’s efficient design can cut costs significantly in high-volume setups.
- You’re building cloud-native apps. Loki’s label-based model fits well with containers and Kubernetes.
- You’re already using Grafana. Adding Loki gives you integrated dashboards for metrics and logs without extra hassle.
- Your log queries are predictable. If you know what labels or fields you want to search, Loki’s queries run fast and clean.
What to Consider When Switching Between Graylog and Loki
Moving from Graylog to Loki
Switching from Graylog to Loki means rethinking how you search your logs. Since Loki only indexes labels, you’ll need to:
- Identify which labels are essential for your log streams and make sure they’re included from the start
- Help your team get used to searching based on labels instead of full-text queries
- Accept that some of the flexible, ad-hoc search power you had with Graylog won’t be there
It’s less about technical hurdles and more about changing how you approach logging and searching.
Moving from Loki to Graylog
Going the other way—Loki to Graylog—is usually about getting more flexible search capabilities. But it comes with some extra setup and cost:
- Be ready for higher storage and infrastructure expenses because Graylog indexes everything
- You’ll need to deploy and manage an Elasticsearch cluster alongside Graylog
- Log shippers might need reconfiguration to send logs in formats that Graylog expects
Switching isn’t trivial, but if full-text searching is critical, Graylog can be worth the effort.
If you’re working with Node.js and want to explore logging options at the code level, our Node.js Logging Libraries guide covers popular tools to complement your logging backend choice.
Practical Optimization Tips for Graylog and Loki
How to Optimize Graylog
Graylog’s performance depends heavily on Elasticsearch, so sizing your cluster correctly is key. More nodes don’t automatically mean better speed—you want the right balance of shard sizes and memory.
Use Graylog’s processing pipelines to pull out important fields when logs come in. Doing this upfront means your queries don’t have to work as hard later.
Also, don’t forget about old data. Setting up index rotation and archival policies helps keep storage costs under control and the system running smoothly.
How to Optimize Loki
With Loki, choosing the right labels is critical. Too many labels, especially high-cardinality ones, can slow things down. Aim for 4 to 6 important labels at most.
Keep your log content consistent and structured. Since Loki doesn’t index full text, make sure the key info you need is easy to parse in your logs.
Finally, get comfortable with LogQL. Combining label filters with line filters smartly can dramatically improve query speed.
Wrapping Up
Graylog suits teams that need powerful full-text search and don’t mind managing a more complex setup. Loki is great if you want a lightweight, cost-efficient tool that fits well with Kubernetes and Grafana.
Choosing the right tool means balancing search flexibility, cost, ease of use, and how your team works with logs. For teams looking to combine logs with metrics and traces for a full observability picture, Last9 offers a managed solution that handles high-cardinality data efficiently and integrates well with OpenTelemetry and Prometheus.
Last9 is trusted by companies like Games24x7, CleverTap, and Replit, helping optimize cloud-native monitoring by balancing performance, cost, and user experience.
If you want to explore how Last9 can fit into your observability stack, book a time with us or get started for free today!
FAQs
Can I run Graylog and Loki together?
Yes, lots of teams do. Loki works well for high-volume application logs, while Graylog is great for security or audit logs that need more detailed searching.
Which tool handles log parsing better?
Graylog comes with more built-in parsers and extractors, so it’s easier to handle various log formats out of the box. Loki needs more upfront work to structure logs, but it often leads to cleaner, more consistent data.
How do retention policies compare?
Graylog relies on Elasticsearch index rotation and deletion policies. Loki uses configurable retention periods with automatic cleanup. Both can be hooked into external archiving systems if you need long-term storage.
What about high availability?
Both support high-availability setups. Graylog requires clustering Elasticsearch and MongoDB. Loki runs in a microservices mode with components split to support scale and redundancy.
Which tool is better for Kubernetes environments?
Loki has a clear advantage here—it integrates natively with Kubernetes, uses label-based queries that match Kubernetes metadata, and fits seamlessly with Grafana. Graylog can work too, but you’ll need a proper log shipping setup.
How do ingestion speeds compare?
Loki usually ingests logs faster since it does minimal indexing. It can handle over 100,000 lines per second using lightweight Promtail agents. Graylog’s ingestion speed depends on Elasticsearch, but with a good setup, it can process 50,000+ messages per second per node.
What are the main performance bottlenecks?
For Graylog, Elasticsearch can slow down during heavy indexing or complex searches. For Loki, problems usually come from too many labels (high cardinality) or inefficient queries that scan large time ranges without filtering.

