

When it comes to keeping systems running smoothly, SRE teams need a way to track what matters. That’s where the Golden Signals play an important role. These are a set of key metrics that help teams monitor the health of their systems by focusing on the most important aspects of performance.
In this blog, we’ll break down what the Golden Signals are, why they’re so important, and how they apply to modern setups like microservices and distributed systems.
What Are the Golden Signals?
The Golden Signals are a set of four crucial metrics that every monitoring system should track.
These metrics are designed to help you quickly diagnose problems in your systems, maintain reliability, and improve performance over time.
The four Golden Signals are:
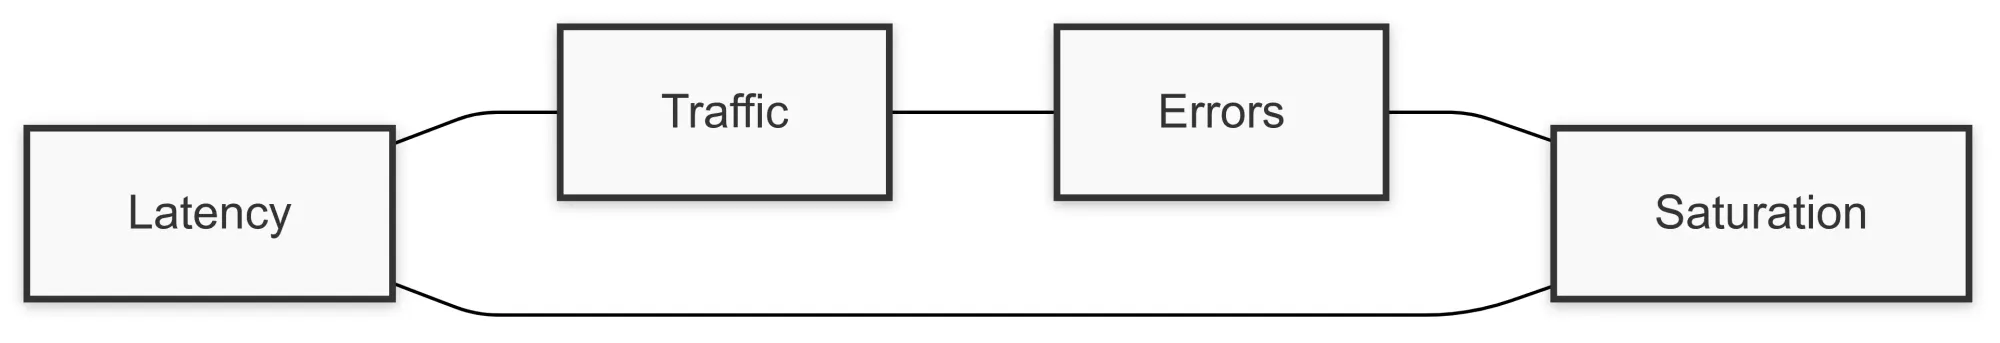
- Latency: How long it takes for a request to be processed by the system. If your latency is too high, users will experience slow performance, which leads to frustration and, ultimately, user churn.
- Saturation: The measure of how much demand is being placed on your system compared to its capacity. Saturation is about understanding when your system is approaching its limits. Too much saturation leads to performance degradation, resource constraints, and, eventually, service failure.
- Error Rate: The percentage of requests that fail. If your error rate rises significantly, it's a strong indicator that something has gone wrong in your system, whether it's a server issue, a broken application, or a misconfigured load balancer.
- Traffic: The number of requests your system is receiving. Monitoring traffic helps determine if the system is being overloaded or if resources need to be scaled up or down to meet demand.

Why Are These Signals So Important?
The importance of the Golden Signals cannot be overstated. With these metrics, SRE teams can:
Ensure System Health: Monitoring metrics like latency, error rate, saturation, and traffic provides insights into overall system health. Deviations from expected values indicate potential issues.
Enable Proactive Monitoring: Real-time observation of these metrics allows teams to address issues before users are affected, reducing downtime and enhancing user experience.
Improve Capacity Planning: Tracking saturation and traffic helps anticipate bottlenecks and plan for future capacity needs, enabling teams to scale resources in advance.
Optimize Performance: High latency or rising error rates highlight issues impacting user experience. These signals guide teams to identify root causes and improve system performance.
How Do These Golden Signals Apply to SRE?
In SRE, reliability is often quantified by Service Level Objectives (SLOs) and Service Level Indicators (SLIs), and the Golden Signals provide the most relevant SLIs to focus on.
Here’s how:
- Latency: If your system’s latency exceeds the SLO, then you know something is wrong. SRE teams use latency to gauge how quickly a service is responding to user requests. This impacts user satisfaction and system performance.
- Saturation: Understanding saturation levels ensures that your system has enough capacity to handle its traffic without degrading performance. SRE teams monitor this to avoid bottlenecks, such as when CPU usage is too high or memory allocation is exceeded.
- Error Rate: If the error rate rises above a certain threshold, it’s time to investigate. High error rates can indicate issues such as failed HTTP requests, problems with APIs, or backend failures, all of which impact reliability and user experience.
- Traffic: The number of requests can tell you if you’re seeing unexpected surges in traffic, which can lead to saturation and eventually system failure. Traffic monitoring helps SRE teams anticipate and handle these surges.
Key Elements of Site Reliability Engineering (SRE)
Site Reliability Engineering (SRE) is all about ensuring systems are reliable, scalable, and efficient.
Here are the core components that form the foundation of SRE practices:
1. Availability
- The cornerstone of reliability—users expect services to be available whenever needed.
- Focuses on minimizing downtime, implementing redundancy, and setting clear Service Level Objectives (SLOs) and Service Level Agreements (SLAs).
2. Performance
- Goes beyond uptime to include the speed and responsiveness of a system.
- Performance tuning involves optimizing latency, throughput, and resource utilization to ensure a smooth user experience.
3. Monitoring and Observability
- Monitoring is about tracking key metrics (e.g., latency, and error rates) to detect issues.
- Observability digs deeper, helping engineers understand the “why” behind system behaviors using logs, traces, and metrics.
4. Incident Management
- Rapidly identifying, diagnosing, and resolving issues to minimize impact.
- Includes post-incident reviews to learn and implement preventative measures.
5. Capacity Planning
- Ensures systems are prepared to handle growth and sudden spikes in demand.
- Balances resource provisioning with cost efficiency to avoid overprovisioning or outages.
6. Automation
- Reduces toil by automating repetitive tasks like deployments, scaling, and recovery.
- Frees up engineers to focus on impactful work, improving overall efficiency.
7. Preparation and Resilience
- Prepares systems for the unexpected through chaos engineering and disaster recovery drills.
- Builds resilience by identifying single points of failure and designing for graceful degradation.

Monitoring Golden Signals with the Right Tools
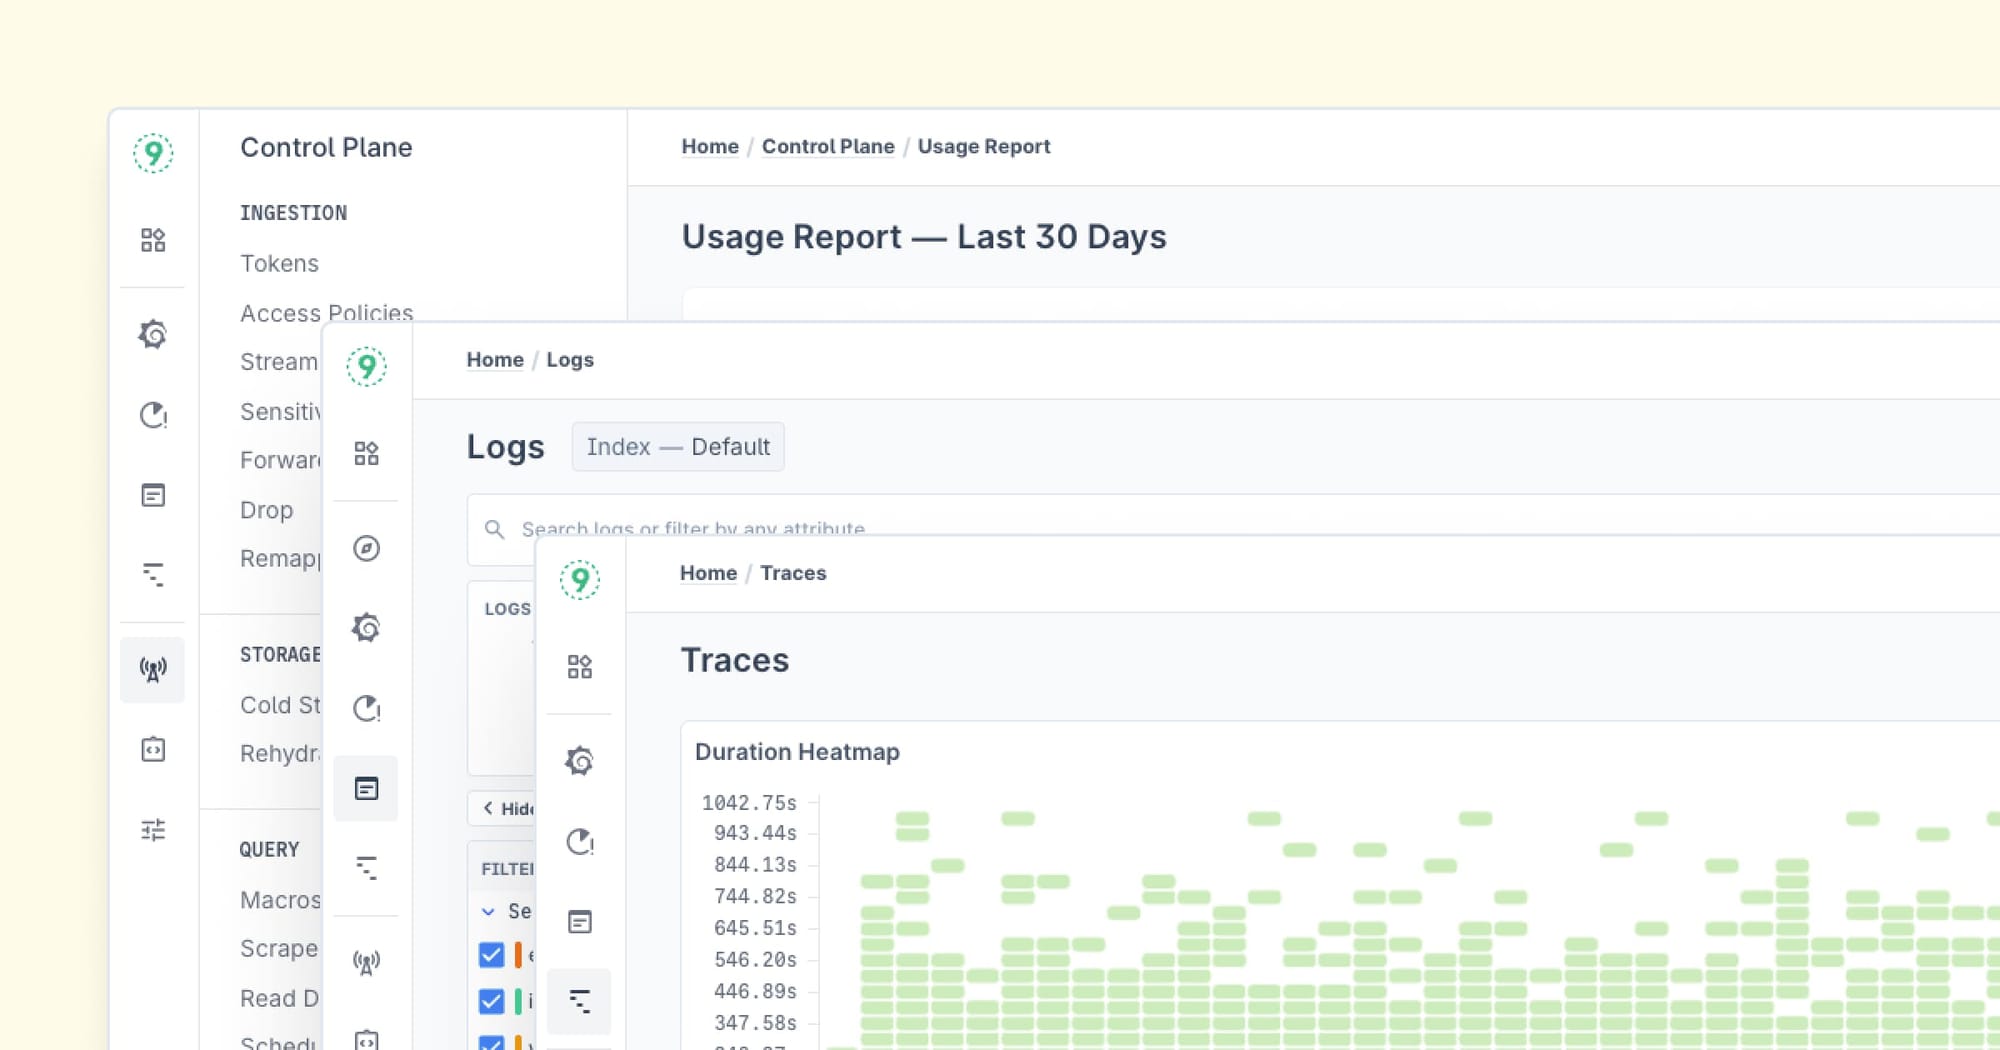
SRE teams use tools like Prometheus, Grafana, and APM solutions such as Last9 to keep an eye on Golden Signals in real-time.
These tools track key metrics, making it much easier to spot and fix issues before they escalate:
Prometheus
Prometheus is an open-source tool designed to collect and store metrics. It plays nicely with Kubernetes and is great for gathering critical metrics like latency, traffic, and error rates. Once collected, Prometheus sends the data to Grafana for visualization.
Grafana
Grafana makes it easy to visualize Golden Signals on custom dashboards. It gives you a clear, real-time view of metrics like latency, traffic, and error rates, so you can quickly gauge system health and identify potential issues.
APM Tools
APM solutions like Last9, New Relic, and Datadog offer deeper insights into how your applications are performing. They help you track metrics across services and pinpoint where things are going wrong, whether it’s an issue in the code, infrastructure, or something else.
Best Practices for Monitoring the Golden Signals
Here are some best practices for monitoring these Golden Signals:
- Set Up Alerts for Anomalies: Use automated alerts to notify you when latency, error rates, or traffic exceeds predefined thresholds. This helps your team react quickly to issues.
- Use Percentiles for Latency: Rather than focusing on average response time, use percentiles (such as 95th or 99th percentile) to track latency. This ensures that you're not just catching outliers but also understanding the impact on the majority of your users.
- Automate Scaling: For saturation and traffic monitoring, set up auto-scaling to ensure that your system has enough resources to handle spikes in demand.
- Correlate Signals: Look at how latency, error rates, and traffic interact. For example, a spike in traffic might cause an increase in latency and error rates, signaling that your system is reaching capacity.
- Utilize Distributed Tracing: For microservices and distributed systems, distributed tracing helps you track requests as they move through the system, providing deeper insight into performance bottlenecks and failures.
How Do Golden Signals Fit into Microservices and Incident Management?
In microservices and distributed systems, tracking the Four Golden Signals—latency, saturation, errors, and traffic—becomes essential due to the complexity of these environments.
These signals not only provide insights into overall system health but also guide teams through the incident management lifecycle.
Latency
- In Microservices: Latency can stack up as requests travel across multiple services, APIs, and databases. Monitoring latency helps pinpoint delays and optimize specific components.
- In Incident Management: Spikes in latency are often the first indicator of an issue. Teams can use this metric during detection and triage to identify bottlenecks and during mitigation to implement temporary fixes, like scaling or rerouting.
Saturation
- In Distributed Systems: Nodes handling requests can reach their saturation point, leading to cascading failures or slowdowns. Monitoring CPU, memory, and network usage helps prevent overload and ensures stability.
- In Incident Management: Saturation metrics highlight resource constraints during triage, guiding actions like provisioning more resources or rebalancing workloads during mitigation.
Errors
- In Complex Architectures: Failures in one service can cascade to others, increasing the overall error rate. Monitoring errors across services helps identify failing components, such as unresponsive databases or misconfigured APIs.
- In Incident Management: Error metrics are critical during detection and triage, pinpointing the root cause of failures. Post-incident reviews rely on these metrics to analyze what went wrong and prevent recurrence.
Traffic
- Across Microservices: Traffic spikes or changes can strain specific services, requiring scaling or redistributing requests. Monitoring both service-level and system-wide traffic helps manage workloads effectively.
- In Incident Management: Abnormal traffic patterns often indicate potential issues. Tracking traffic aids in triage and informs strategies like rate limiting or autoscaling during mitigation.

How to Troubleshoot Performance Degradation
When things start slowing down—whether it’s high latency or rising error rates—the Golden Signals are your first go-to for figuring out what’s going wrong.
Here’s a quick guide to help you troubleshoot effectively using these signals:
Latency Spikes
When latency spikes, start by checking the infrastructure—are resources maxed out? If everything looks good there, dig into service-level metrics.
Is it a slow database query, a network bottleneck, or perhaps some inefficient code causing the delay?
Error Rate Increases
A sudden increase in error rates usually points to a problem with a service, an API misconfiguration, or maybe a resource issue.
If you’re seeing HTTP 500s or 503s, that’s a strong indicator of server overload or a failing backend service. Check the error logs and health checks to get more details.
Saturation and Resource Utilization
When you notice saturation levels rising or system resources nearing full capacity, your system might be struggling to handle the load. Look into CPU usage, memory allocation, and network bandwidth.
Are your services maxing out? If so, it could be time to scale up or optimize your resource usage.
Traffic Spikes
A sudden traffic spike could catch your system off guard. Check your monitoring dashboards for patterns—was the increase due to a marketing campaign, a new product launch, or a spike in user interest? Understanding this can help you better prepare for future traffic surges.
Conclusion
Focusing on the Golden Signals—latency, saturation, error rate, and traffic—helps SRE teams improve system reliability, performance, and scalability.
Today, monitoring and observability are more critical than ever. With tools like Prometheus, Grafana, Last9, and other monitoring systems, SRE teams can gain real-time visibility into system health and take action to ensure the best possible user experience.
FAQs
Q1: What are the Golden Signals?
The Golden Signals are four key metrics for monitoring the health and performance of systems: latency, saturation, error rate, and traffic. These signals help SRE teams understand how well their systems are performing and identify potential problems before they affect users.
Q2: What are the 4 signals of SRE?
The four signals of SRE are the same as the Golden Signals: latency, saturation, error rate, and traffic. These metrics are central to monitoring and maintaining system reliability.
Q3: What are the 4 Golden Signals of red use?
The term "red use" may be a bit unclear. If you're referring to the "Red" signal in the context of error rates, it highlights problems in your system such as failed requests or broken responses that lead to performance degradation. Error rate (a golden signal) is often associated with identifying these "red flags" in the system.
Q4: What are the 4 Golden Rules of Observability?
While the Golden Signals provide a foundation for observability, the four Golden Rules could refer to principles like measuring what matters, ensuring full coverage, monitoring in real-time, and acting on the data. These rules help teams ensure they’re collecting the right data and using it to drive decisions.
Q5: Why are the Golden Signals important?
They are critical because they provide a quick and effective way to monitor system performance, identify issues, and prevent downtime. By focusing on these four signals, SRE teams can ensure high availability and optimize user experience.
Q6: What is a REST API?
A REST API is a standard for designing web services that allows communication between a client and server over HTTP. It’s an essential part of modern web and mobile applications, where services rely on APIs to send and receive data.
Q7: Why isn’t liveness part of the Golden Signals?
While liveness checks if a service is up and running, the Golden Signals focus on the performance of the service—latency, error rate, saturation, and traffic. Liveness checks are valuable, but they don’t directly correlate to how well the system is performing.
Q8: What level of saturation ensures service performance and availability for customers?
The right level of saturation varies by system. However, a good rule of thumb is to aim to keep your system below 80-85% of its capacity to ensure enough resources for handling unexpected surges without compromising performance.
Q9: Are customers consistently experiencing page load or latency lag?
Tracking latency and traffic will help answer this. If users consistently experience slow page loads, check your latency metrics across your services. Identify whether it’s due to a backend service or a resource constraint.
Q10: How do the Golden Signals apply to a microservices architecture?
In a microservices setup, the Golden Signals help track the performance of each service, making it easier to identify bottlenecks or failures. They help teams ensure that requests are processed efficiently and that services scale appropriately under load.
Q11: How do the Golden Signals apply to monitoring distributed systems?
In distributed systems, the Golden Signals offer insight into how each component is performing, helping teams identify issues that may affect the entire system. Latency, for example, can increase as requests pass through multiple services, while traffic can give you an indication of system load at different points in the architecture.

