

Monitoring Kubernetes can be tricky. Scaling microservices and troubleshooting issues can make it challenging to monitor the health of your clusters. That’s where OpenTelemetry comes in. With OpenTelemetry’s powerful observability tools, you can get a deeper look into your applications and infrastructure.
In this guide, we’ll discuss how to set up OpenTelemetry using the Helm chart on Kubernetes. Plus, we’ll explain how integrating with Last9’s observability platform makes monitoring your clusters even easier and more efficient.
What is OpenTelemetry?
Before getting into the Helm Chart details, let’s revisit OpenTelemetry.
OpenTelemetry is an open-source framework that enables developers to collect telemetry data from their applications, providing deep insights into their performance.
Designed to be vendor-agnostic, OpenTelemetry integrates with a variety of backends, such as Prometheus, Jaeger, and others, ensuring flexibility and compatibility for diverse observability needs.
For more on setting up observability in Kubernetes with OpenTelemetry, check out our detailed guide on using the OpenTelemetry Operator.
How to Install and Configure the OpenTelemetry Helm Chart on Kubernetes
Step 1: Add the OpenTelemetry Helm Repository to Your Helm Configuration
Start by adding the OpenTelemetry Helm Chart repository to your Helm configuration.
Run the following commands to add the repository and update your Helm repository list:
helm repo add open-telemetry https://open-telemetry.github.io/opentelemetry-helm-chartshelm repo updateStep 2: Deploy the OpenTelemetry Operator Using Helm
Once the repository is added, you can install the chart using the following command:
helm install opentelemetry open-telemetry/opentelemetry-operatorThis will deploy the OpenTelemetry operator, which takes care of managing OpenTelemetry resources within your Kubernetes cluster.
Step 3: Customize Your OpenTelemetry Setup
The values.yaml file lets you adjust the OpenTelemetry components to match your specific needs. Here’s how you can configure some common options:
- Enable Exporters: Exporters like Jaeger, Prometheus, or Zipkin can be used for tracing and metrics. Enable them by setting the appropriate values in the
values.yamlfile:
exporters: jaeger: enabled: true prometheus: enabled: trueTip for Efficient Resource Management:
When deploying OpenTelemetry in large Kubernetes environments, consider adjusting resource limits and using pod affinity to ensure OpenTelemetry components run on nodes with sufficient resources.
Step 4: Check the Status of Your OpenTelemetry Deployment
After the installation, verify the deployment status to ensure everything is working as expected. Use the following command:
kubectl get pods -n opentelemetryThis will display the running OpenTelemetry components, confirming they are ready to collect and export telemetry data.
- Adjust Resource Requests and Limits: Tailor resource allocation to ensure the OpenTelemetry components run efficiently within your cluster:
resources: requests: cpu: "100m" memory: "128Mi" limits: cpu: "500m" memory: "512Mi"- Enable Sampling: Control the trace sampling to manage the amount of telemetry data sent to your backend. For example:
sampling: rate: 0.1 # 10% samplingFor a step-by-step guide on instrumenting your Kubernetes cluster with OpenTelemetry and sending logs to Last9, check out the Kubernetes logs integration docs.
Why Use the OpenTelemetry Helm Chart?
Helm charts simplify managing Kubernetes applications by packaging all configurations and dependencies into reusable templates.
This packaging allows you to deploy complex applications as a single, cohesive unit. Helm charts save time and reduce errors by managing Kubernetes resources such as Deployments, ConfigMaps, and Secrets in a way that’s both consistent and repeatable.
Here’s why it’s a key tool:
1. Simplified Deployment
Deploying OpenTelemetry components manually in Kubernetes can involve a steep learning curve, with numerous configurations and dependencies to manage.
The Helm Chart eliminates this complexity by offering pre-configured templates for the OpenTelemetry Collector, Agent, and Exporters.
It reduces the risk of errors and saves time, enabling developers to focus on refining their telemetry pipelines rather than wrestling with deployment hurdles.
To learn more about monitoring with the OpenTelemetry Collector, check out our full guide to OTel Collector monitoring best practices.
2. Uniformity Across Clusters
For cloud-native observability, consistency is crucial. The Helm Chart ensures that your deployments maintain identical configurations across different Kubernetes clusters.
This uniformity guarantees that telemetry data is collected, processed, and exported predictably, regardless of the environment.
3. Flexible Configuration Options
While the Helm Chart provides ready-to-use defaults, it also supports extensive customization.
The values.yaml file allows you to fine-tune your OpenTelemetry deployment to meet specific needs. You can configure exporters, adjust resource requests and limits, or enable additional OpenTelemetry components. This gives you flexibility while maintaining the efficiency of a template-based deployment process.
4. Built-in Scalability
As Kubernetes workloads scale, so does the volume of telemetry data. The OpenTelemetry Helm Chart is designed to handle this growth, providing a robust framework to manage increased metrics and trace data seamlessly.
Its scalability ensures that your observability setup remains performant and reliable, even as your infrastructure expands.
Learn more about capturing host metrics with OpenTelemetry in our detailed guide.
What Are Presets for Metrics and Logs in Kubernetes?
In Kubernetes environments, presets act as pre-configured templates that simplify the setup of telemetry collection for metrics and logs.
These templates automatically capture key data, saving you from manual configuration and ensuring you get the critical metrics and logs you need for observability and troubleshooting.
Let’s understand the different types of presets available.
Logs Presets: Simplified Collection of Key Logs
Log presets automatically collect application, system, and container logs, ensuring you capture critical data with minimal effort.
With presets, you don’t have to manually configure each log source—everything is set up for you. This helps streamline troubleshooting and enhances your monitoring workflows.
Kubernetes Attributes Presets: Capture Essential Metadata
Kubernetes-specific attributes like pod names, namespaces, labels, and annotations are automatically captured through presets.
This metadata is invaluable for correlating logs and metrics with specific resources, helping you quickly identify the root cause of issues and understand the context of your data.
Kubelet Metrics Presets: Monitor Node Health
The kubelet collects node-level metrics, such as node health and resource utilization.
With kubelet metrics presets, this data is collected automatically, ensuring you have the insights needed to monitor the health of your infrastructure without manual configuration.
Cluster Metrics: High-Level Overview of Cluster Health
Cluster metrics presets focus on the overall health of your Kubernetes environment.
These presets capture essential data like resource usage across nodes, pod statuses, and cluster-wide events. This gives you a high-level view of your cluster’s health, allowing you to monitor its state with minimal effort.
Kubernetes Events Presets: Track Important Cluster Activities
Kubernetes events preset automatically log important activities like pod failures, scaling events, and deployments.
Enabling these presets ensures critical cluster events are tracked, allowing you to act quickly and resolve any issues.
Host Metrics: Monitoring Infrastructure Health
Host metrics presets track the key performance indicators (KPIs) for your underlying infrastructure—things like CPU, memory, disk, and network usage.
Monitoring these alongside your Kubernetes resources gives you a holistic view of your environment’s health.
For a guide on Kubernetes log collection using the OpenTelemetry FileLog receiver, check out the full article.
Why Use Presets?
Presets are a powerful tool for setting up observability with minimal effort. They provide you with pre-configured templates for common monitoring use cases, enabling you to start collecting telemetry data right away.
With presets in place, you can focus on analyzing your data and taking action, rather than spending time on manual configuration.
To learn how to use Jaeger with OpenTelemetry, check out our detailed guide.
The Role of OpenTelemetry Collector in Kubernetes
The OpenTelemetry Collector is crucial for gathering, processing, and exporting telemetry data in Kubernetes environments.
Supporting metrics, logs, and traces, it integrates seamlessly into observability setups and enables a streamlined process for monitoring and troubleshooting.
Here’s a look at its key components and how they work in Kubernetes:
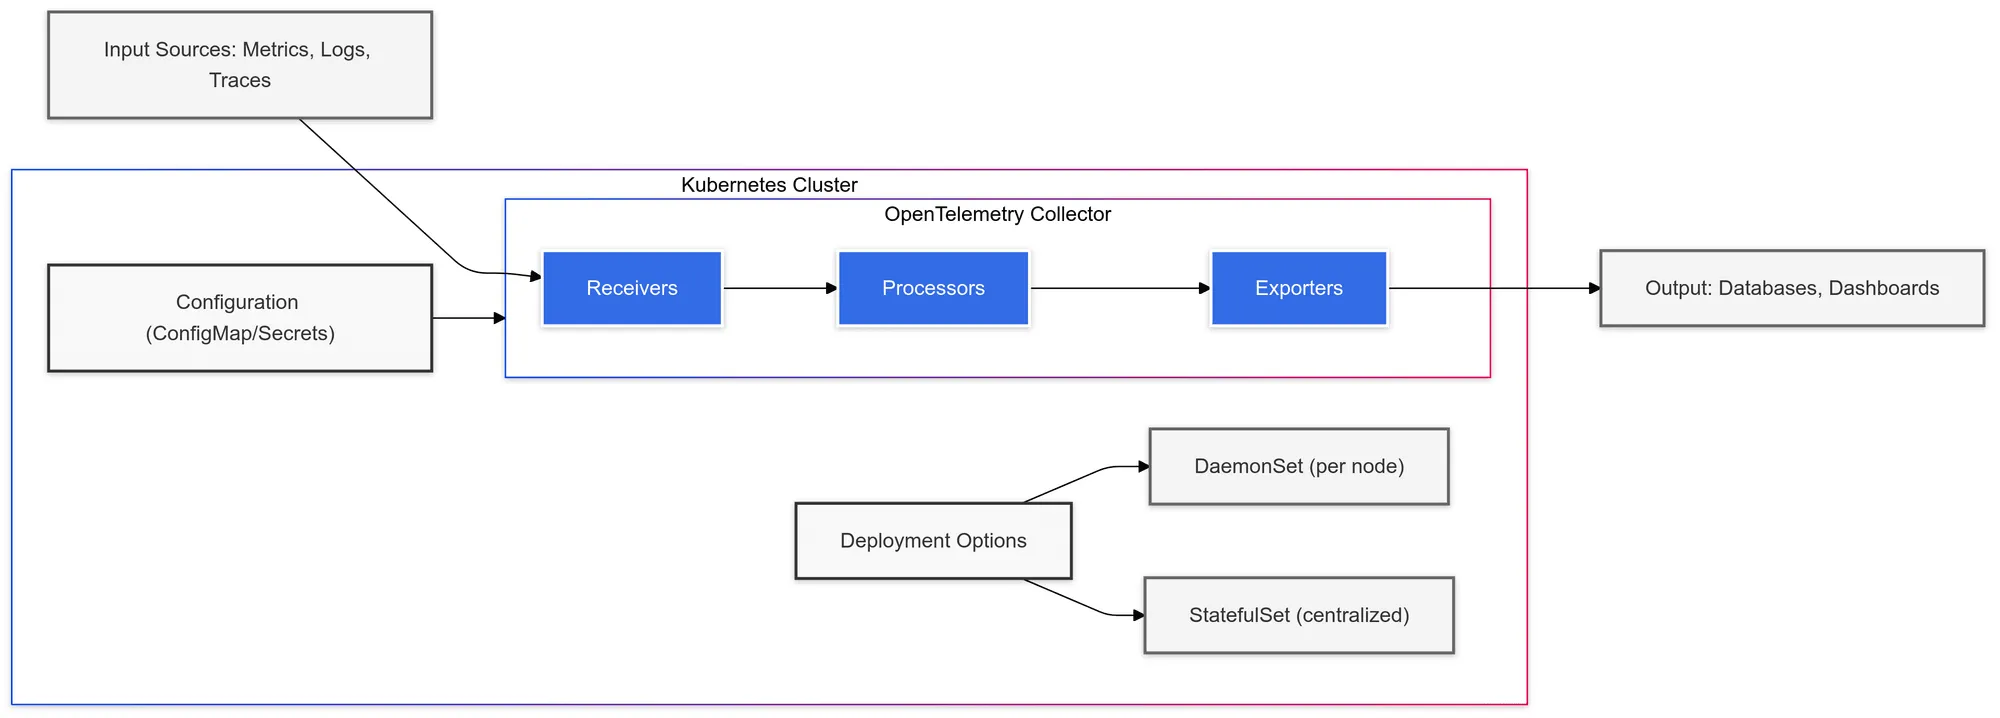
Key Components of the OpenTelemetry Collector
Receivers
Receivers collect telemetry data from various sources. In Kubernetes, common receivers include:
- Prometheus for scraping metrics
- Kubernetes API servers for cluster-specific data
- Fluentd for collecting logs from pods and system components
Processors
Processors modify incoming data to optimize its value. Key functions include:
- Batching data for efficient transmission
- Filtering out unnecessary data
- Enriching telemetry with additional context
Exporters
Exporters send the processed data to external systems, such as:
- Time-series databases like Prometheus
- Visualization tools such as Grafana
- Cloud-based monitoring platforms
Deploying the OpenTelemetry Collector in Kubernetes
- DaemonSet
Deploying the Collector as a DaemonSet ensures that it runs on every node in your cluster. This setup is ideal for gathering telemetry data at both the node and pod levels, ensuring comprehensive monitoring across your entire infrastructure. - StatefulSets or Deployments
For centralized telemetry collection, the Collector can also be deployed using StatefulSets or Deployments. These approaches allow for a fixed number of replicas with persistent configurations, ensuring consistency in data processing and exporting.
How do the Collector Configurations Happen?
The Collector’s configuration is defined in a YAML file that specifies the receivers, processors, and exporters in use. This file is typically stored as a ConfigMap or a Secret in Kubernetes, enabling easy updates across your cluster.
Key Configuration Examples:
- Scraping metrics and logs from Kubernetes
- Accessing the Kubernetes API to collect real-time data about your cluster
How to Configure Environment Variables and Resource Limits
The performance of the Collector depends heavily on its environment settings:
- Resource Allocation: Kubernetes allows you to set CPU and memory limits for Collector pods to prevent overloads.
- Environment Variables: Use environment variables for managing authentication, proxy settings, and exporter configurations. Kubernetes integrates seamlessly with secrets for the secure handling of sensitive details, like API keys or tokens.
Interactivity with Kubernetes
The Collector interacts extensively with the Kubernetes API to gather telemetry data from pods, nodes, and other cluster resources. It collects logs from both system components and applications, acting as a key component in your observability stack.
For more on monitoring Kubernetes metrics, check out our guide on the Kubernetes Metrics Server.
Conclusion
The OpenTelemetry Helm Chart is a great way to simplify observability in Kubernetes. It’s easy to deploy, scales well, and offers the flexibility needed for cloud-native environments.
If you’re looking to tie all your telemetry data together, Last9 can help bring metrics, logs, and traces into a single view, making it easier to track down issues, manage alerts, and keep your systems running smoothly.
It integrates easily with tools like Prometheus and OpenTelemetry, giving you better visibility into performance and errors—especially in complex, distributed setups.
Schedule a demo with us to know more!

