

Understanding how your applications perform is crucial. OpenTelemetry has emerged as a powerful observability framework, offering a standardized approach to collecting telemetry data such as metrics, logs, and traces.
For Java developers, the OpenTelemetry Java SDK provides the tools necessary to instrument applications effectively. This guide is all about the OpenTelemetry Java SDK, exploring its components, configuration, and advanced features to help you harness its full potential.
Introduction to OpenTelemetry Java SDK
OpenTelemetry is an open-source observability framework that provides APIs, libraries, agents, and instrumentation to enable the collection of distributed traces and metrics from applications.
The Java SDK is a language-specific implementation designed to integrate seamlessly with Java applications, offering robust tools to capture and export telemetry data.
For a step-by-step guide on instrumenting Java applications with OpenTelemetry, check out this tutorial on best practices.
Key Components of the OpenTelemetry Java SDK
To effectively instrument your application with OpenTelemetry, it’s important to understand its core components.
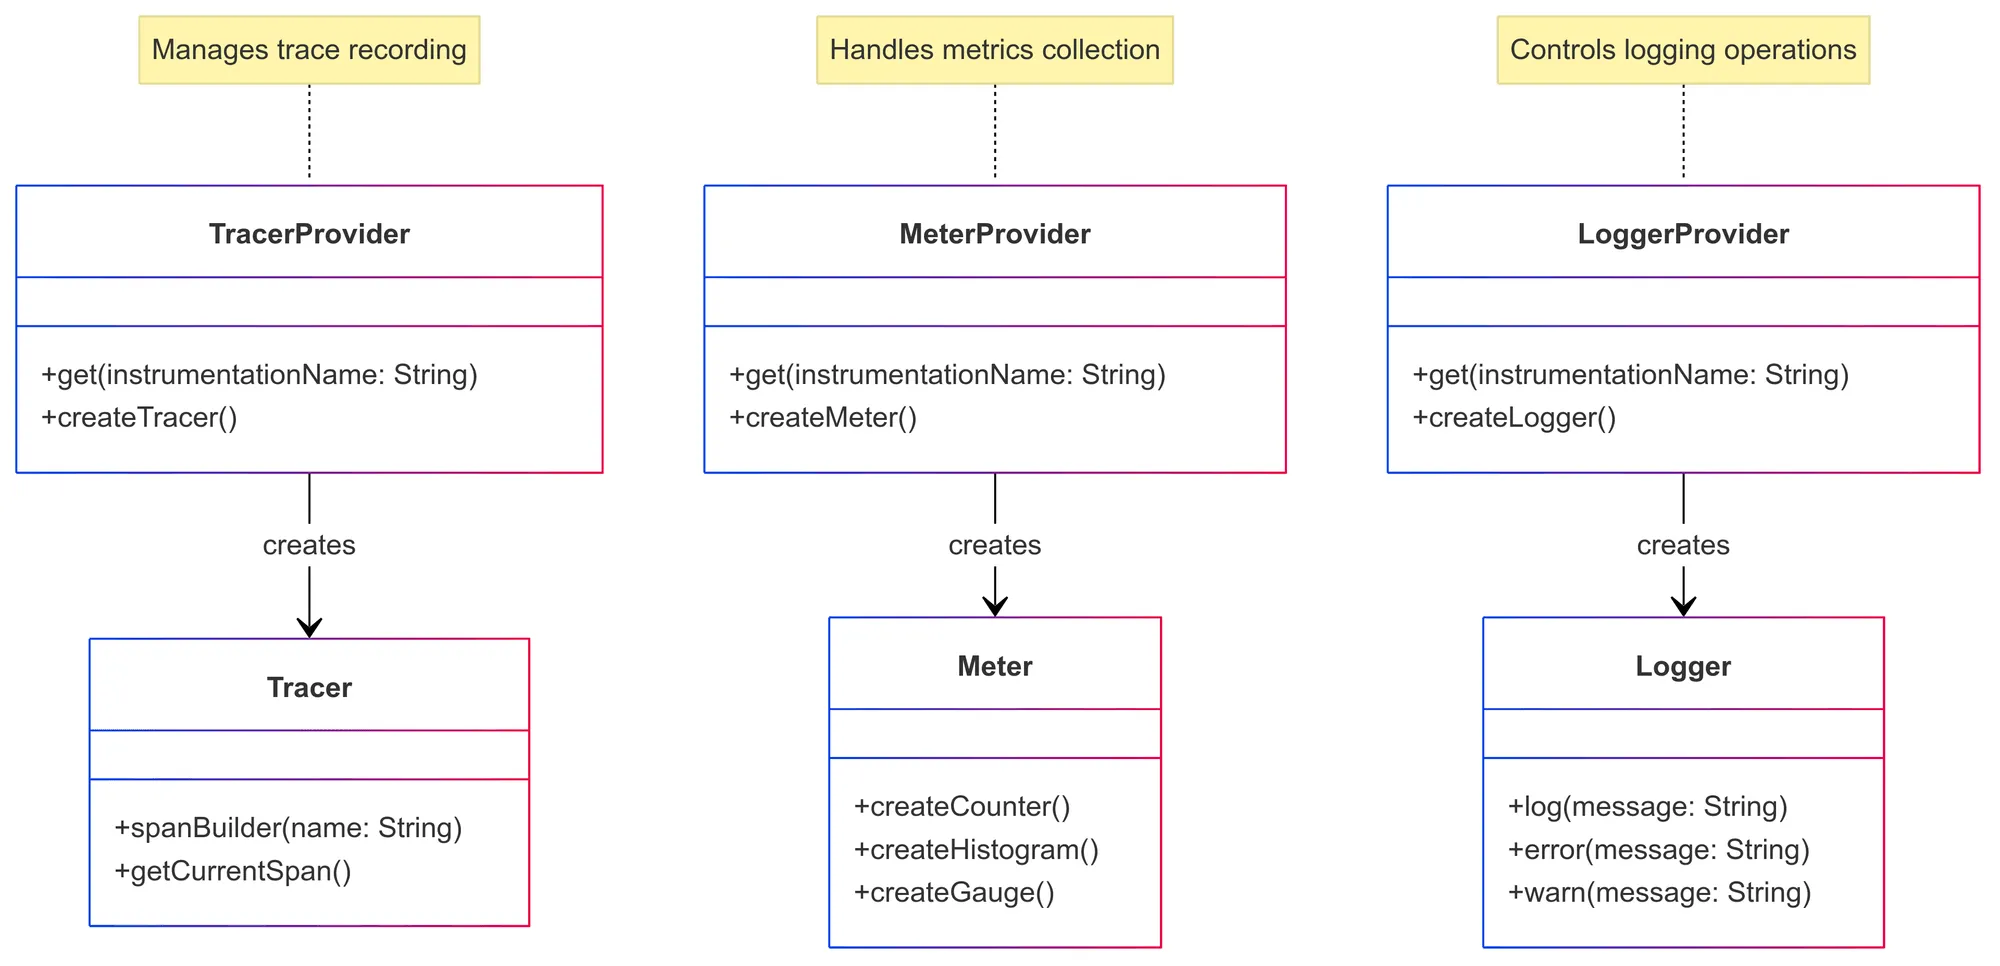
TracerProvider
Think of the TracerProvider as the factory for creating Tracer instances. Tracers help capture and record tracing data, giving you insights into how different parts of your application interact. Each Tracer is tied to a specific instrumentation library, allowing you to control tracing at a granular level.
MeterProvider
The MeterProvider is responsible for generating Meter instances, which collect various performance metrics. Meters track things like request counts, response times, and system resource usage—helping you measure and optimize your application’s performance.
LoggerProvider
The LoggerProvider creates Logger instances for capturing logs. When combined with tracing and metrics, logs provide a complete picture of your application’s behavior, making it easier to diagnose issues and understand how different events are connected.
For more on collecting and managing metrics with OpenTelemetry, visit this in-depth article on OpenTelemetry Metrics.
How to Get Started with OpenTelemetry Java SDK
To begin using the OpenTelemetry Java SDK, follow these steps:
- Add Dependencies: Include the necessary OpenTelemetry libraries in your project. If you’re using Maven, add the following to your
pom.xml:
<dependencyManagement>  <dependencies>    <dependency>      <groupId>io.opentelemetry</groupId>      <artifactId>opentelemetry-bom</artifactId>      <version>1.44.1</version>      <type>pom</type>      <scope>import</scope>    </dependency>  </dependencies></dependencyManagement>
<dependencies> <dependency> <groupId>io.opentelemetry</groupId> <artifactId>opentelemetry-api</artifactId> </dependency> <dependency> <groupId>io.opentelemetry</groupId> <artifactId>opentelemetry-sdk</artifactId> </dependency> <!-- Add exporters and other components as needed --></dependencies>- Initialize the SDK: Set up the SDK in your application’s entry point. For example:
import io.opentelemetry.api.GlobalOpenTelemetry;import io.opentelemetry.api.trace.Tracer;import io.opentelemetry.sdk.OpenTelemetrySdk;import io.opentelemetry.sdk.trace.SdkTracerProvider;import io.opentelemetry.sdk.trace.export.BatchSpanProcessor;import io.opentelemetry.exporter.otlp.trace.OtlpGrpcSpanExporter;
public class MyApp {    public static void main(String[] args) {        // Configure the SpanExporter        OtlpGrpcSpanExporter spanExporter = OtlpGrpcSpanExporter.builder()            .setEndpoint("http://localhost:4317")            .build();
        // Configure the SdkTracerProvider        SdkTracerProvider tracerProvider = SdkTracerProvider.builder()            .addSpanProcessor(BatchSpanProcessor.builder(spanExporter).build())            .build();
        // Initialize the OpenTelemetry SDK        OpenTelemetrySdk openTelemetry = OpenTelemetrySdk.builder()            .setTracerProvider(tracerProvider)            .build();
        // Set the global OpenTelemetry instance        GlobalOpenTelemetry.set(openTelemetry);
        // Your application code here    }}
This setup initializes the OpenTelemetry SDK with a gRPC span exporter, sending data to the specified endpoint. Ensure that the endpoint matches your observability backend’s configuration.
How to Configure the OpenTelemetry Java SDK
Proper configuration is key to ensuring the OpenTelemetry SDK runs smoothly in your application.
Programmatic Configuration
Programmatic configuration means setting up the SDK components directly in your code. This approach is flexible and works well when you need dynamic configurations.
For example, here’s how you can configure a TracerProvider programmatically:
import io.opentelemetry.api.trace.Tracer;import io.opentelemetry.api.trace.TracerProvider;import io.opentelemetry.api.GlobalOpenTelemetry;
public class TracingExample {    public static void main(String[] args) {        // Get a Tracer instance        Tracer tracer = GlobalOpenTelemetry.getTracer("my-application", "1.0.0");
        // Use the tracer to create spans (traces)        var span = tracer.spanBuilder("my-span").startSpan();
        try {            // Do some work inside the span            System.out.println("Tracing in action!");        } finally {            span.end(); // Always end spans        }    }}
This approach gives you full control over how tracing functions within your application. Similar methods can be used to configure MeterProvider for collecting metrics and LoggerProvider for capturing logs.
How to Configure the SDK
Configuring the OpenTelemetry Java SDK allows you to tailor the telemetry collection to meet the specific needs of your application.
The SDK provides various configuration methods, from simple zero-code setups to more detailed programmatic customization using Java APIs.
1. Zero-Code Configuration
For ease of setup, OpenTelemetry offers configuration options that don’t require any changes to your code. These approaches allow you to adjust the SDK’s behavior through deployment settings.
- Environment Variables: Modify configuration parameters externally, making it easy to adjust telemetry behavior dynamically.
Example:
export OTEL_TRACES_EXPORTER=jaegerexport OTEL_METRICS_EXPORTER=prometheusexport OTEL_LOGS_EXPORTER=otlpexport OTEL_RESOURCE_ATTRIBUTES=service.name=my-service,env=production- System Properties: Pass configuration values directly to the JVM at runtime, often used in containerized environments.
Example:
-Dotel.traces.exporter=zipkin -Dotel.service.name=my-java-app- Service Provider Interface (SPI): Enables automatic discovery of OpenTelemetry components (like exporters and propagators) using the Java
META-INF/servicesmechanism.
These zero-code methods are especially useful in cloud and containerized environments where configuration management is externalized.
To learn more about setting up and using the OpenTelemetry Collector, check out this comprehensive guide.
2. Programmatic Configuration
For more control over telemetry behavior, you can configure the OpenTelemetry SDK directly in your code. This allows for greater flexibility and customization, making it ideal for applications with specific needs.
- Configuring the OpenTelemetry SDK:
Example:
SdkTracerProvider tracerProvider = SdkTracerProvider.builder()    .setResource(Resource.create(Attributes.of(AttributeKey.stringKey("service.name"), "my-service")))    .addSpanProcessor(BatchSpanProcessor.builder(OtlpSpanExporter.getDefault()).build())    .build();
OpenTelemetry openTelemetry = OpenTelemetrySdk.builder() .setTracerProvider(tracerProvider) .build();- Customizing Exporters: Configure different backends to export telemetry data, such as sending data to an external service.
Example:
OtlpMetricExporter metricExporter = OtlpMetricExporter.builder() .setEndpoint("http://localhost:4317") .build();- Adjusting Context Propagation: Specify context propagation mechanisms such as W3C TraceContext or B3 for tracing correlation across services.
3. Hybrid Approaches
Many organizations prefer a mix of zero-code and programmatic configurations to balance ease of deployment with the need for custom logic. For example, you can use environment variables to set defaults and override them programmatically when necessary.
Example:
String exporter = System.getProperty("otel.traces.exporter", "otlp");SpanExporter spanExporter = exporter.equals("jaeger") ? JaegerGrpcSpanExporter.builder().build() : OtlpSpanExporter.getDefault();4. Dynamic Configuration via OpenTelemetry Collector
For dynamic updates without requiring a restart, OpenTelemetry supports external configuration through the OpenTelemetry Collector. This allows you to manage exporters, batching, and sampling policies without having to modify the application code, making it easier to adjust settings at runtime.
These options make OpenTelemetry highly flexible, whether you need a simple, zero-code solution or fine-grained control over telemetry collection.
Steps for Telemetry Data Management
The OpenTelemetry Java SDK provides multiple mechanisms to manage telemetry, including plugin extension interfaces, internal logging practices, and sampling strategies to optimize data collection.
1. Plugin Extension Interfaces
The OpenTelemetry Java SDK is designed for extensibility, allowing developers to customize and extend telemetry collection through plugin interfaces:
- SpanProcessors: Modify or filter spans before they are exported.
- Example: Implementing a custom span processor to filter out low-priority spans
class CustomSpanProcessor implements SpanProcessor {    @Override    public boolean isStartRequired() { return true; }
    @Override    public void onStart(Context context, ReadWriteSpan span) {        if (span.getName().contains("healthcheck")) {            span.setAttribute("otel.dropped", true);        }    }
    @Override    public boolean isEndRequired() { return true; }
    @Override    public void onEnd(ReadableSpan span) { /* Custom logic */ }
@Override public void shutdown() { }}- Metric Processors: Aggregate and filter metrics before they are exported.
- Log Processors: Customize how logs are handled before export.
These interfaces help tailor telemetry collection to application needs, reducing unnecessary data and optimizing performance.
For a detailed guide on hosting metrics using OpenTelemetry, check out this article on host metrics.
2. Internal Logging Practices
The OpenTelemetry Java SDK uses structured internal logging to assist in debugging and observability of the SDK itself:
- SDK Debug Logging: Enables detailed logs to troubleshoot issues in instrumentation or data export.
- Example: Setting debug logging in a Java application:
export OTEL_LOG_LEVEL=debug- Self-Monitoring with OpenTelemetry:
- OpenTelemetry can instrument itself by capturing internal logs and metrics.
- Example: Exporting OpenTelemetry SDK metrics to monitor span processing rates and export failures.
3. Sampling Strategies for Data Management
To prevent excessive telemetry data generation, OpenTelemetry offers sampling techniques to control trace collection:
- AlwaysOnSampler: Captures all traces (useful for debugging).
- AlwaysOffSampler: Disables tracing.
- ParentBasedSampler: Follows the sampling decision of a parent span.
- TraceIdRatioBasedSampler: Samples a percentage of requests for cost-effective tracing.
- Example: Sampling 10% of traces programmatically:javaCopyEdit
Sampler sampler = TraceIdRatioBasedSampler.create(0.1);SdkTracerProvider tracerProvider = SdkTracerProvider.builder() .setSampler(sampler) .build();4. Exporter Management
The SDK allows dynamic configuration of telemetry exporters to balance observability and performance:
- Batch Exporting: Batches telemetry data before sending it to reduce network overhead.
- Export Filtering: Drop or modify telemetry data before exporting to meet compliance and cost constraints.
Example: Configuring a batch span processor for optimized exporting:
BatchSpanProcessor spanProcessor = BatchSpanProcessor.builder(OtlpSpanExporter.getDefault()) .setScheduleDelay(5000, TimeUnit.MILLISECONDS) .build();How the Instrumentation Ecosystem Works in OpenTelemetry Java
OpenTelemetry Java provides a comprehensive ecosystem for collecting observability data—traces, metrics, and logs—in distributed applications.
Whether you prefer automatic instrumentation for ease of use, manual instrumentation for fine-tuned control, or third-party integrations for flexibility, OpenTelemetry offers a robust solution.
1. Automatic Instrumentation
Automatic instrumentation simplifies telemetry collection by injecting tracing and metrics without requiring changes to the application code. It works using a Java agent that instruments widely used frameworks dynamically.
- OpenTelemetry Java Agent – A prebuilt Java agent that attaches to your application and automatically instruments commonly used libraries such as Spring Boot, JDBC, Kafka, gRPC, and HTTP clients.
- Instrumentation Libraries – A set of modules that provide built-in observability support for popular Java frameworks.
- Configuration via Environment Variables – Allows fine-tuning of instrumentation behavior without modifying application code.
This approach is ideal for quickly enabling observability without additional development effort.
For more on configuring OpenTelemetry with environment variables, check out this guide on using OpenTelemetry environment variables.
2. Manual Instrumentation
For applications requiring custom telemetry data, OpenTelemetry provides APIs and SDKs that allow developers to define exactly what is captured.
- Tracing API – Enables the creation and propagation of spans to track request flows.
- Metrics API – Captures custom performance metrics such as request latency and resource usage.
- Logging API – Integrates structured logging with traces and metrics for deeper insights.
- Context Propagation – Ensures telemetry data remains correlated across distributed services.
This method provides greater flexibility, allowing developers to fine-tune observability to meet specific needs.
3. Third-Party Integrations
OpenTelemetry supports various exporters and monitoring platforms, enabling seamless data collection and visualization.
- Exporters – OpenTelemetry Java SDK includes built-in support for Jaeger, Zipkin, Prometheus, OpenTelemetry Collector, and more.
- Integration with Monitoring Platforms – Many observability solutions, including Last9, New Relic, and AWS X-Ray, offer native OpenTelemetry support.
- OpenTelemetry Collector – A vendor-neutral component that aggregates and processes telemetry data before forwarding it to a backend system.
4. Extensibility and Community Contributions
The OpenTelemetry ecosystem is highly extensible, allowing developers to build custom instrumentation modules and contribute to the broader community. The open-source nature of the project ensures continuous improvements and support for emerging technologies.
To understand the differences between OpenMetrics and OpenTelemetry, check out this detailed comparison.
Conclusion
The OpenTelemetry Java SDK makes it simple to add observability to your application.
You can collect traces, metrics, and logs to monitor performance, using either automatic instrumentation or custom configuration.
With flexible setup options and a rich ecosystem, OpenTelemetry helps you gain valuable insights into your application’s behavior, enabling you to make informed improvements.
And if you’d like to discuss this further, our Discord community is open. We have a dedicated channel where you can connect with other developers and share insights about your specific use case.

