

OpenTelemetry is the go-to open-source standard for observability, but when it comes to tracking frontend performance and user interactions, things get a little tricky.
Unlike backend services, browsers introduce challenges like CORS restrictions, asynchronous execution, and limited access to certain telemetry data.
This guide covers everything you need to know about using OpenTelemetry in the browser, from setup to best practices, advanced configurations, and real-world debugging techniques.
OpenTelemetry and Its Role in Frontend Monitoring
OpenTelemetry (OTel) is an observability framework for collecting, processing, and exporting telemetry data (traces, metrics, and logs). It provides a consistent way to instrument applications across different programming languages and environments.
In backend services, OpenTelemetry works smoothly with various exporters, but in the browser, there are unique challenges such as network restrictions, security concerns, and performance overhead. This guide will walk you through how to effectively use OpenTelemetry in frontend applications, going beyond just basic setup.
For a deeper understanding of how to visualize OpenTelemetry data, check out our guide on OpenTelemetry visualization.
OpenTelemetry Architecture and Key Components
OpenTelemetry consists of several key components that work together to collect and process telemetry data:
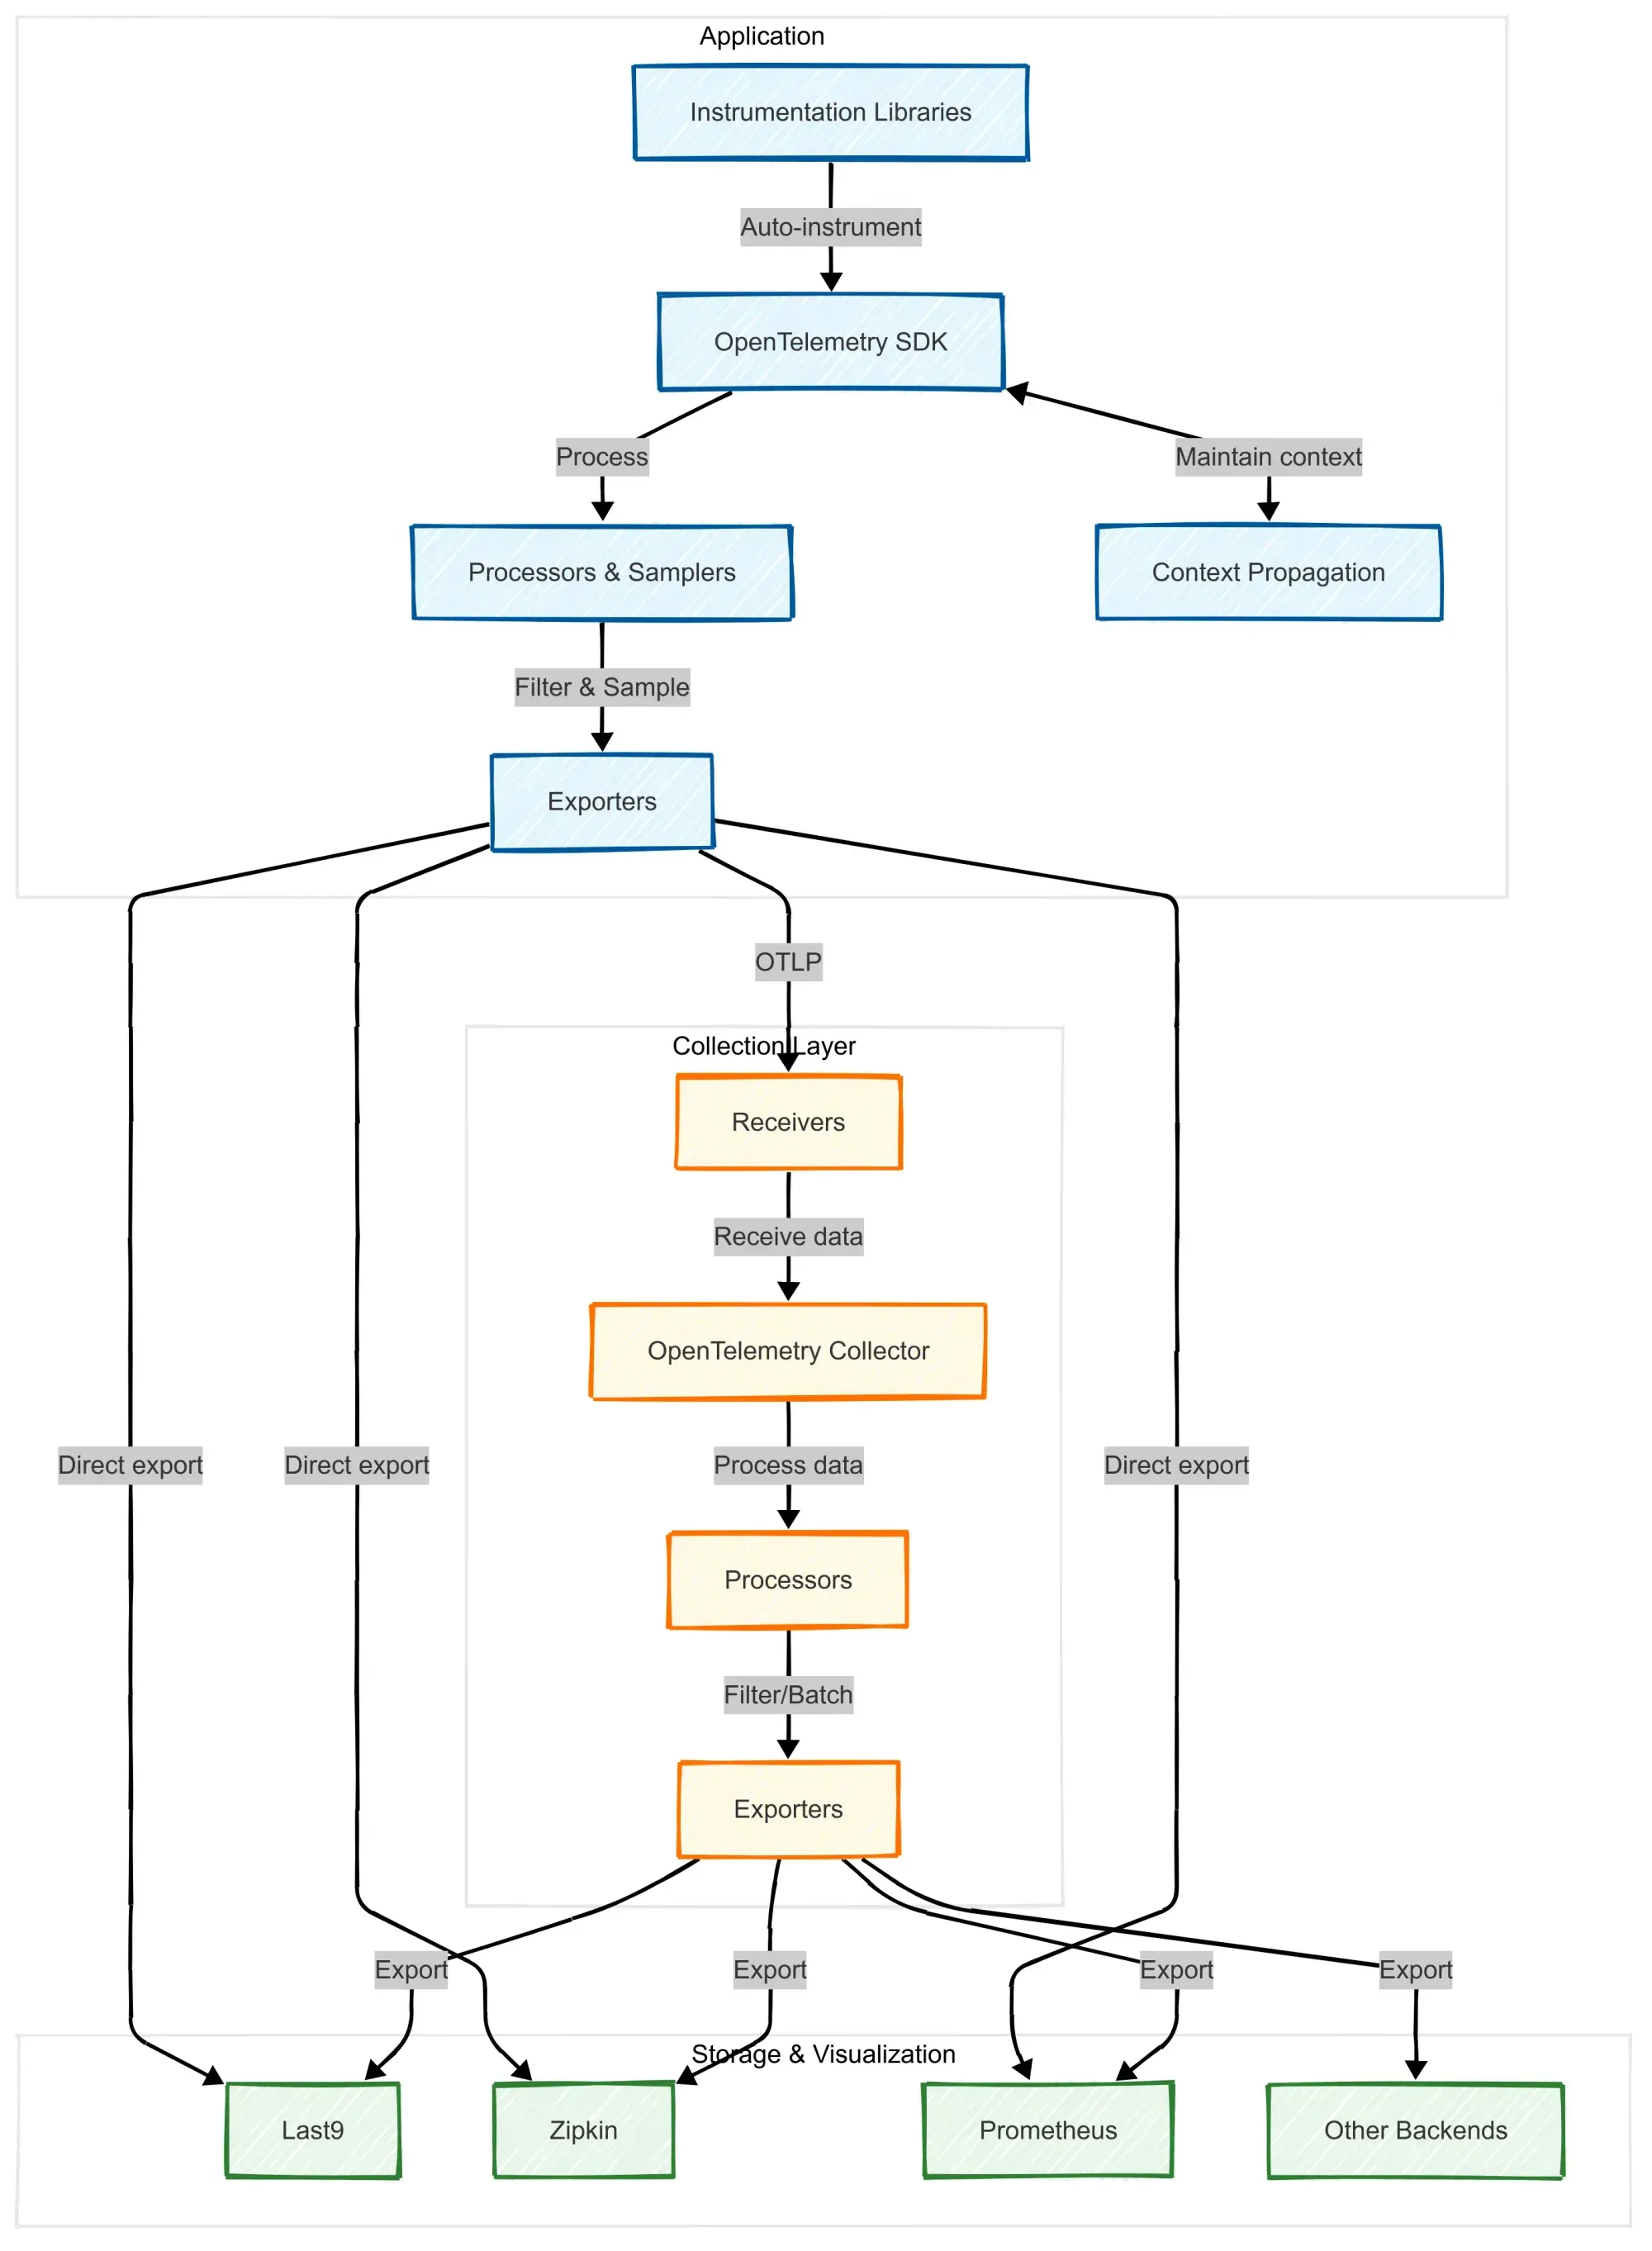
- SDK (Software Development Kit): The OpenTelemetry SDK provides APIs and utilities for instrumenting applications. In browser environments, this includes web tracing, user interaction instrumentation, and context propagation.
- Collector: The OpenTelemetry Collector is an optional but recommended component that receives telemetry data, processes it (e.g., filtering, batching), and exports it to different backends such as Last9, Zipkin, or Prometheus.
- Exporters: Exporters send telemetry data from the SDK to observability platforms. The OTLP (OpenTelemetry Protocol) exporter is commonly used for sending data to OpenTelemetry backends.
- Instrumentation Libraries: Pre-built libraries help automatically capture telemetry data for common browser events, such as fetch requests, user interactions, and page loads.
- Processors and Samplers: These help optimize the amount of telemetry data sent by filtering unnecessary traces or adjusting the sampling rate dynamically.
- Context Propagation: OpenTelemetry ensures that traces remain connected across distributed systems using context propagation, which is critical for tracking user journeys across frontend and backend services.
Understanding this architecture is crucial to effectively implement OpenTelemetry in frontend applications and ensuring smooth data flow between the browser, the collector, and the backend observability tools.
To learn how OpenTelemetry processors can enhance your data before exporting, check out our guide on OpenTelemetry processors.
Why Frontend Developers Need OpenTelemetry for Observability
Observability isn’t just for backend services. In modern applications, a slow front end can be just as bad as a slow API. OpenTelemetry helps you:
- Track page load times, rendering performance, and user interactions.
- Measure frontend performance bottlenecks.
- Correlate frontend traces with backend traces to get a full picture of request flows.
- Get real user monitoring (RUM) without relying on proprietary solutions.
Step-by-Step Guide: Setting Up OpenTelemetry for Browser Applications
1. Installing Required OpenTelemetry Packages
You’ll need the core OpenTelemetry packages for JavaScript:
npm install @opentelemetry/api @opentelemetry/core @opentelemetry/sdk-trace-web @opentelemetry/exporter-trace-otlp-http2. Configuring OpenTelemetry for Browser-Based Instrumentation
Create an instrumentation file (e.g., otel.js) and configure OpenTelemetry:
import { WebTracerProvider } from "@opentelemetry/sdk-trace-web";import {  ConsoleSpanExporter,  SimpleSpanProcessor,} from "@opentelemetry/sdk-trace-base";import { OTLPTraceExporter } from "@opentelemetry/exporter-trace-otlp-http";
const provider = new WebTracerProvider();
// Export traces to OpenTelemetry backendconst exporter = new OTLPTraceExporter({  url: "https://otel-collector.example.com/v1/traces",});provider.addSpanProcessor(new SimpleSpanProcessor(exporter));
// Also log traces to the console (optional, for debugging)provider.addSpanProcessor(new SimpleSpanProcessor(new ConsoleSpanExporter()));
// Register the providerprovider.register();
console.log("OpenTelemetry initialized");
Include this file in your project, ensuring it runs as early as possible in your app.
3. Tracking User Interactions with OpenTelemetry
To track user interactions, install the @opentelemetry/instrumentation-user-interaction package:
npm install @opentelemetry/instrumentation-user-interactionThen, initialize it:
import { UserInteractionInstrumentation } from "@opentelemetry/instrumentation-user-interaction";
const userInteractionInstrumentation = new UserInteractionInstrumentation();userInteractionInstrumentation.setTracerProvider(provider);
This automatically captures interactions like button clicks and form submissions, helping you monitor user journeys.
If you’re deploying OpenTelemetry with Docker, check out our guide on setting up the OpenTelemetry Collector with Docker.
How to Handle CORS and Security Issues When Sending Telemetry Data
One of the biggest hurdles with browser telemetry is CORS. Most OpenTelemetry backends require CORS headers to accept requests from browsers.
Configuring CORS in the OpenTelemetry Collector
To fix this, update your OpenTelemetry collector configuration to allow cross-origin requests:
receivers: otlp: protocols: http: cors: allowed_origins: ["*"] allowed_headers: ["authorization", "content-type"]While using "*" allows all origins, it’s recommended to specify allowed origins explicitly to improve security:
allowed_origins: ["https://your-frontend-app.com"]Using a Reverse Proxy for Secure Telemetry Forwarding
If modifying CORS settings isn’t an option, you can use a reverse proxy like Nginx to forward telemetry requests:
server { location /v1/traces { proxy_pass http://otel-collector:4318/v1/traces; add_header 'Access-Control-Allow-Origin' '*'; add_header 'Access-Control-Allow-Methods' 'POST, OPTIONS'; add_header 'Access-Control-Allow-Headers' 'Authorization, Content-Type'; }}Security Considerations
- Avoid exposing sensitive user data in telemetry spans.
- Restrict CORS settings to trusted origins whenever possible.
- Use authentication mechanisms (API keys or OAuth tokens) to secure telemetry endpoints.
- Monitor telemetry traffic to detect anomalies or unauthorized access.
For a detailed look at configuring OpenTelemetry using environment variables, check out our guide on OpenTelemetry environment variables.
Best Practices for OpenTelemetry in the Browser
- Use Adaptive Sampling: Adjust sampling rates dynamically to optimize data collection based on traffic volume.
- Minimize Performance Overhead: Keep telemetry lightweight and async to avoid impacting user experience.
- Secure Telemetry Data: Avoid exposing sensitive information in spans by scrubbing or masking personally identifiable information (PII).
- Ensure Trace Context Propagation: Link frontend traces with backend requests using
traceparentheaders to maintain trace continuity. - Monitor Real Users, Not Just Synthetic Tests: Rely on real-world performance data rather than simulated scenarios for accurate insights.
- Leverage OpenTelemetry Collector for Aggregation: Instead of sending traces directly from the browser, use a collector to batch and optimize data transmission.
- Set Up Error and Exception Tracking: Instrument frontend error handling to capture unhandled exceptions and correlate them with traces.
Conclusion
OpenTelemetry makes it easier to monitor browser apps by collecting key telemetry data. Start implementing it today for better insights.
And if you need an OpenTelemetry backend that’s easy to set up, budget-friendly, and built for performance, give Last9 a try. Check out our detailed documentation for a step-by-step guide to integrating it with your existing setup.
FAQs
1. Can OpenTelemetry track frontend metrics like FCP and LCP?
Yes, but it requires additional instrumentation. OpenTelemetry’s primary focus is tracing, but Web Vitals libraries can be integrated for metrics.
2. What’s the best exporter for frontend telemetry?
OTLP (OpenTelemetry Protocol) is recommended as it integrates well with various OpenTelemetry backends.
3. How do I ensure frontend traces correlate with backend traces?
Use trace context propagation with traceparent headers to maintain continuity across requests.
4. Does OpenTelemetry slow down the front end?
If properly configured with sampling and batching, the performance impact is minimal.
5. How do I visualize OpenTelemetry browser traces?
Use tools like Last9, Zipkin, or Grafana to analyze frontend traces and correlate them with backend events.

