

When it comes to log management, observability, and security analytics, Elastic (formerly ELK Stack) and Splunk are two of the biggest contenders. But which one is the right fit for your needs?
This guide compares their architecture, pricing, scalability, and integrations—giving you a clear picture of their strengths, trade-offs, and real-world applications.
What Are Elastic and Splunk?
Elastic (ELK Stack)
Elastic is an open-source search and analytics engine, often deployed as part of the ELK Stack (Elasticsearch, Logstash, and Kibana).
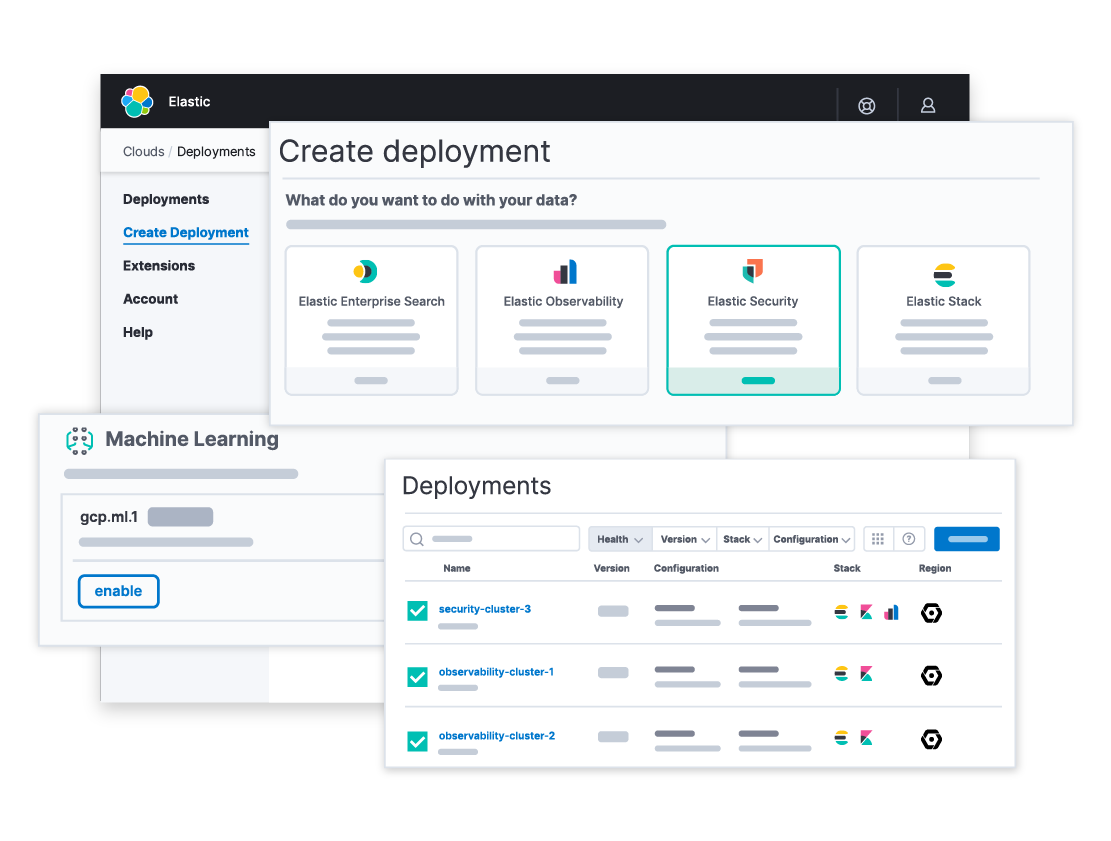
It excels in indexing and searching massive amounts of log data, making it a go-to choice for many developers and SREs handling observability and security workloads.
Functionality:
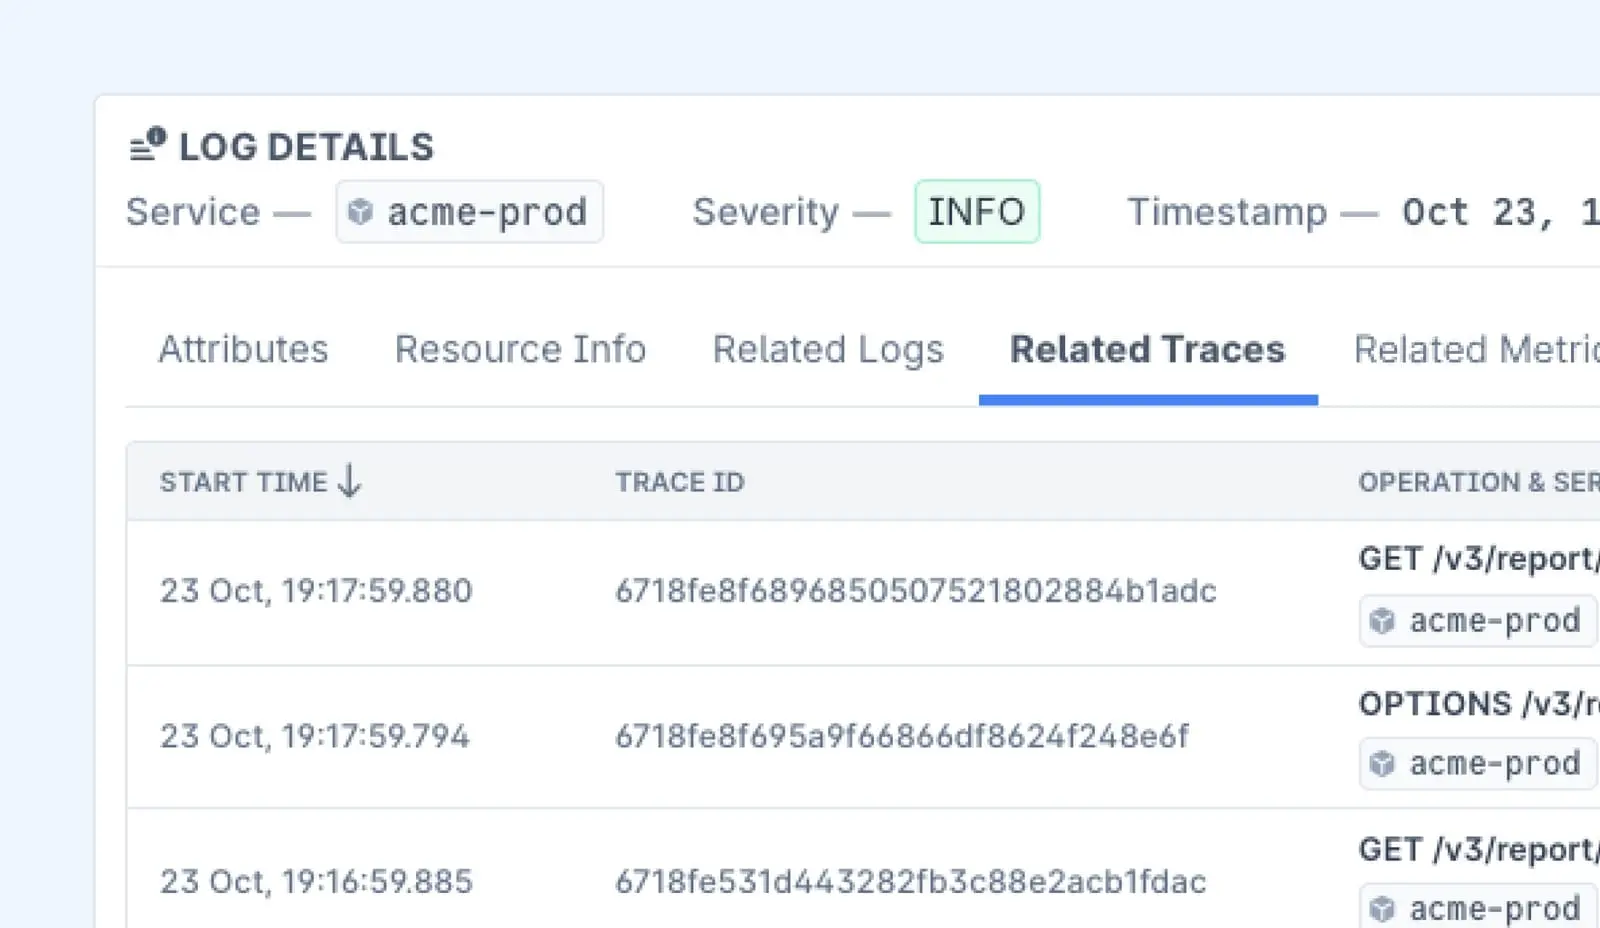
Elastic is designed to collect, store, and analyze structured and unstructured data at scale. It provides real-time search capabilities, log aggregation, and analytics through Kibana.
With features like Elastic Security, users can detect threats and manage incidents effectively. Elastic Observability enables teams to monitor logs, metrics, and traces in a unified platform, making it a powerful solution for DevOps and security teams.
Strengths of Elastic:
- Cost-Effective and Open-Source: Offers a free tier with flexible deployment options, reducing vendor lock-in concerns.
- Scalability: Scales horizontally, allowing organizations to handle high-ingestion workloads efficiently.
- Powerful Search Capabilities: Uses Elasticsearch’s distributed search functionality, making it highly performant for large datasets.
- Flexible Visualization: Kibana provides customizable dashboards and reporting tools tailored to various observability and security needs.
- Integration with OpenTelemetry: Supports OpenTelemetry for distributed tracing and observability.
Weaknesses of Elastic:
- Learning Curve: Elasticsearch Query DSL can be complex for new users compared to Splunk’s SPL.
- Management Overhead: Self-hosted deployments require expertise in cluster tuning, maintenance, and scaling.
- Security Features Require Licensing: Advanced security capabilities, including SIEM features, require an enterprise license.
Splunk
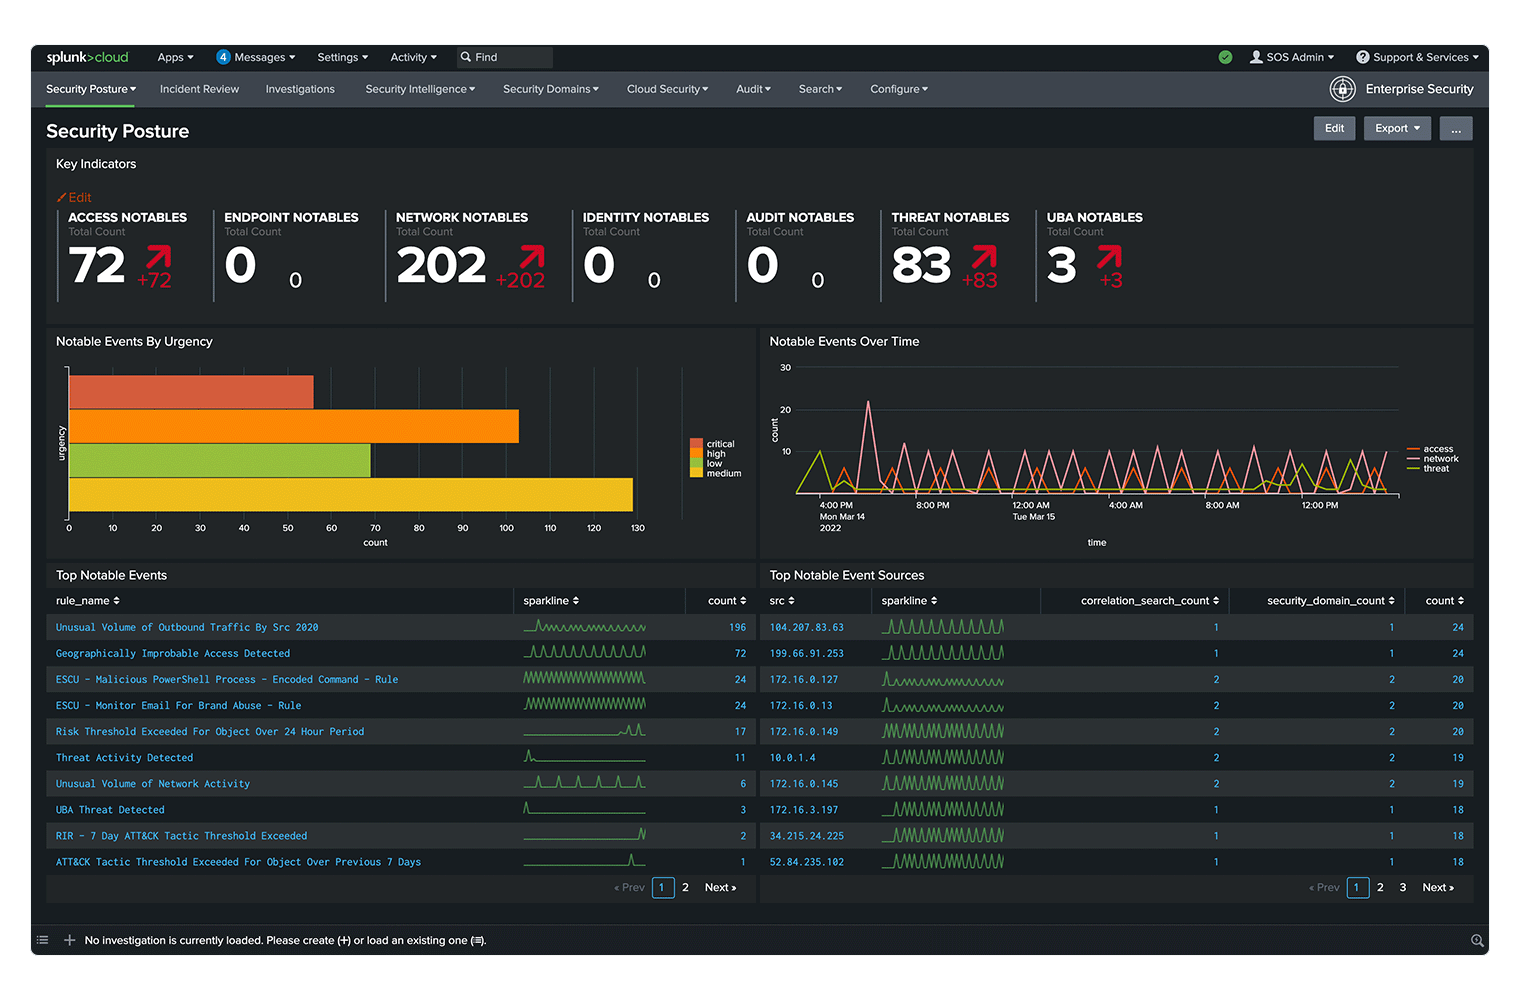
Splunk is a proprietary platform built for collecting, analyzing, and visualizing machine data. It offers robust log management, security information, event management (SIEM), and real-time analytics, making it a favorite for enterprise security and IT operations teams.
Functionality:
Splunk is designed to index, search, and analyze machine-generated data from various sources. It provides log aggregation, event correlation, and anomaly detection, making it a strong tool for observability and security use cases.
With Splunk Dashboard Studio, users can create interactive dashboards for real-time data visualization. Additionally, Splunk’s AIOps features help automate issue detection and resolution, improving IT operations efficiency.
Strengths of Splunk:
- User-Friendly Search Capabilities: Uses Search Processing Language (SPL), which is easy to learn and allows for complex data queries.
- Real-Time Monitoring: Provides real-time insights, making it a strong choice for security and operations teams.
- Enterprise-Grade Security Features: Advanced SIEM capabilities, compliance monitoring, and security analytics make it a top choice for SOC teams.
- Extensive Integrations: Works well with third-party tools and cloud services, offering built-in connectors for popular enterprise applications.
- Scalability: Can handle large volumes of data effectively, making it suitable for enterprises with high-ingestion workloads.
Weaknesses of Splunk:
- Cost: Pricing is based on data ingestion volume, which can become prohibitively expensive as log data grows.
- Resource-Intensive: Requires significant infrastructure resources and can be complex to manage at scale.
- Vendor Lock-In: Being a proprietary solution, organizations may find it difficult to migrate away from Splunk once integrated.
Key Differences Between Elastic and Splunk
When evaluating Elastic and Splunk, it's crucial to understand their differences in deployment, pricing, scalability, search capabilities, observability, security, integrations, and visualization.
Below is a detailed comparison of both tools:
Deployment
- Elastic: Offers self-hosted and cloud deployment options. Users can run it on their infrastructure or use Elastic Cloud for a managed experience.
- Splunk: Primarily a proprietary solution with both on-premises and cloud options. Splunk Cloud provides a fully managed experience for enterprises.
Pricing Model
- Elastic: Open-source with a free tier available. Paid options are based on resource usage rather than data ingestion.
- Splunk: Pricing is based on data ingestion, which can become expensive as log volume grows.

Scalability
- Elastic: Designed for horizontal scaling. Can handle high-ingestion workloads efficiently but requires careful cluster management.
- Splunk: Scales well but can become costly at higher ingestion volumes.
Search and Query Capabilities
- Elastic: Uses Elasticsearch Query DSL, which is powerful but has a steep learning curve.
- Splunk: Uses Search Processing Language (SPL), which is more intuitive and optimized for log search and analytics.
Observability & APM
- Elastic: Supports OpenTelemetry for distributed tracing and observability. Provides an integrated observability suite.
- Splunk: Offers Splunk Observability Cloud, a fully managed platform with built-in APM, log monitoring, and tracing.
Security & SIEM
- Elastic: Features Elastic Security, an open SIEM solution with customizable security analytics.
- Splunk: Industry leader in SIEM with advanced threat detection, compliance, and security analytics.
Ecosystem & Integrations
- Elastic: Strong integrations with OpenTelemetry, Kubernetes, and various cloud platforms.
- Splunk: Extensive enterprise integrations with security, IT, and cloud tools.
Visualization & Reporting
- Elastic: Uses Kibana for data visualization, offering flexible and customizable dashboards, but requires setup and configuration.
- Splunk: Provides Splunk Dashboard Studio, a user-friendly interface with pre-built templates for faster reporting.
A Quick Summary of Elastic vs Splunk
| Feature | Elastic (ELK Stack) | Splunk |
|---|---|---|
| Deployment | Self-hosted or cloud | Proprietary with cloud and on-prem options |
| Pricing Model | Free-tier with paid enterprise options | Expensive, based on data ingestion |
| Scalability | Horizontally scalable | Scales well but costly at scale |
| Search Capabilities | Elasticsearch Query DSL (steep learning curve) | SPL (easier to learn, optimized for logs) |
| Observability & APM | OpenTelemetry support with Elastic Observability | Splunk Observability Cloud (fully managed) |
| Security & SIEM | Elastic Security (open SIEM) | Industry leader in SIEM with advanced features |
| Ecosystem & Integrations | Strong with OpenTelemetry, Kubernetes | Extensive enterprise integrations |
| Visualization & Reporting | Kibana (customizable but requires setup) | Dashboard Studio (pre-built, user-friendly) |
When to Choose Elastic
If you're a developer or an SRE looking for a log management solution that gives you flexibility, scalability, and cost-effectiveness, Elastic is a strong choice.
Here’s why:
- You want an open-source, cost-effective log management and observability solution. Elastic gives you full control over your data without the high licensing costs that proprietary solutions impose. The open-source nature means you can deploy it on your infrastructure and avoid vendor lock-in.
- You're comfortable with managing and tuning Elasticsearch for performance. Elastic offers immense power, but it requires fine-tuning. If you know how to optimize your queries, shard allocation, and indexing strategy, you can squeeze out incredible performance.
- You need high scalability without restrictive licensing. Elastic scales horizontally, meaning you can distribute workloads across multiple nodes without worrying about an expensive per-ingestion licensing model.
- You're working with OpenTelemetry for distributed tracing. If you're already using OpenTelemetry for monitoring and observability, Elastic’s native support ensures seamless integration.
When to Choose Splunk
Splunk is built for enterprises that prioritize ease of use, deep security analytics, and a managed experience.
If your team values plug-and-play functionality with minimal operational overhead, Splunk may be the right choice.
- You need a fully managed, enterprise-ready solution with strong security analytics. Splunk is widely used for Security Information and Event Management (SIEM). If compliance and security analytics are a priority, Splunk’s advanced threat detection capabilities make it a solid investment.
- Your organization can afford a premium solution with world-class SIEM capabilities. Splunk’s pricing model is based on data ingestion, which can get expensive. However, large enterprises often justify the cost due to Splunk’s out-of-the-box compliance monitoring and incident response capabilities.
- You prefer a simpler search language (SPL) over Elasticsearch’s query DSL. Splunk’s SPL is designed for quick and intuitive log searches, making it easier to get started compared to Elastic’s query DSL.
- You want built-in compliance and IT operations monitoring. Splunk provides robust IT Service Intelligence (ITSI) and security monitoring features, making it an all-in-one solution for enterprises needing pre-built compliance frameworks.
Final Thoughts
Elastic and Splunk each have their strengths. Elastic offers flexibility, open-source tools, and cost-effective observability at scale. Splunk, on the other hand, is a feature-rich enterprise solution with top-tier security and compliance capabilities.
But if you’re looking for a managed observability solution that simplifies monitoring while optimizing both performance and cost, Last9 is the way to go. Trusted by industry leaders like Games24x7, CleverTap, and Replit, Last9 is a Telemetry Data Platform designed to balance scalability, efficiency, and user experience.
With Last9, we eliminated the toil. It just works. – Matt Iselin, Head of SRE, Replit
With seamless integrations for OpenTelemetry, Prometheus, and more, Last9 unifies metrics, logs, and traces—efficiently managing high-cardinality data without breaking the bank.
Schedule a demo or start your free trial today!

