

Docker logs can be overwhelming when you're knee-deep in debugging production issues. This guide covers the essential docker logs and tail commands that will save you hours of troubleshooting, complete with real examples from containerized applications.
What Are Docker Logs?
Every Docker container writes to standard output (stdout) and standard error (stderr). Docker captures this output and stores it using a logging driver, making it easy to access via the CLI. Whether you're running a MySQL database or a Node.js app, you can view container logs using simple commands.
Basic docker logs command structure
docker logs container_nameView logs from a specific container ID
docker logs abc123def456Key Features of Docker Logs
Docker handles logs using logging drivers, which define where and how your container logs are stored or shipped. By default, Docker uses the json-file driver, but there are other options depending on how you want to manage logs.
json-file(default): Stores logs in structured JSON format on the host. Great for local debugging and easy to parse.syslog: Sends logs to the host’s system logger. Useful if you already usesyslog-based infrastructure like rsyslog or journald.- Other drivers: Docker supports several other drivers, like
fluentd,awslogs,gelf,logstash, and more—handy if you're integrating with external log aggregation systems.
Each driver changes how logs are handled, stored, and forwarded—so it's worth picking the right one for your environment.
Why Are Docker Logs Important?
When you're debugging production issues, access to container logs can make or break your response time. For example, while troubleshooting a Node.js API container that was failing health checks, running:
docker logs --tail 100 api-container | grep ERRORQuickly revealed database connection timeouts that weren’t visible in the application monitoring dashboard. Without these logs, we’d still be assuming.
Essential Commands for Working with Docker Logs
When something’s off in your container, logs are usually the fastest way to figure out what’s going wrong. These are the commands that tend to come up most often when debugging.
View logs from a container
docker logs container_nameFetches everything your container has printed to stdout and stderr. If your app logs directly to the console (which most do in containers), you’ll see the full log history here, even if the container has already exited.
Follow logs in real-time
docker logs -f container_nameStreams new logs as they’re written—similar to tail -f. Useful when you’re actively monitoring behavior after a deploy or restart.
Limit output with --tail
docker logs --tail 100 container_nameOnly want the last 100 lines instead of the entire scrollback? This keeps things readable when logs get noisy.
Combine --tail and -f
docker logs -f --tail 50 container_nameGrab the most recent lines, then watch the output live. This is one of the most common combos when debugging issues that are happening now.
Add timestamps
docker logs -t container_namePrints each line with a timestamp prefix. Handy when comparing logs across multiple containers or matching events with external systems.
View Logs with Docker Compose
If you’re running multiple containers using docker-compose, these commands make it easier to keep track of what each service is doing.
View logs from all services
docker compose logsOutputs logs from every container defined in your docker-compose.yml—grouped by service.
Follow specific service logs
docker compose logs -f mysql apiShows live log output for just the mysql and api services. This avoids the wall of text you’d get from everything running at once.
A Quick Note on Logging Drivers
Docker uses logging drivers to decide how and where to store container logs. You can change this per container or configure it globally.
Choose based on your environment:
json-file(default): Stores logs as JSON files on disk. Great for local dev and quick access.syslog: For setups using the system’s logger (like journald or rsyslog).fluentd,awslogs,gelf, etc.: For pushing logs to log aggregators or external observability tools.
Example:
docker run --log-driver=fluentd your_imageIf you're just getting started, stick with json-file. But if you're running containers in production and need centralized logging, it's worth switching to something that integrates with your stack.
Advanced Log Management in Docker
Once you're comfortable with the basics, it's worth learning how to manage logs more efficiently, especially when you’re debugging tricky, production-grade issues.
Here are a few commands to filter logs by content or time, and how Docker handles logs across operating systems.
Tail Command Variations
You’ve probably used docker logs -f before, but there are a few variations that give you more control depending on what you're debugging.
Follow logs in real-time
docker logs -f container_nameStreams live output from the container’s stdout and stderr. This is often your first step when something goes wrong after a deploy or restart.
Show recent logs and then follow
docker logs -f --tail 100 container_nameStart with the last 100 lines, then continue watching new ones. Useful when a container is failing repeatedly, you get some context without flooding your terminal.
Run and immediately tail the logs
docker run -d nginx && docker logs -f $(docker ps -q -l)This runs a container in the background, then tails logs for the most recently launched container. It’s a quick way to debug startup behavior in freshly run containers.
Cross-Platform Log Locations
Sometimes you need to look at the raw log files Docker stores on disk, especially when logs aren’t showing up in the CLI, or you want to collect them manually.
On Linux/Unix systems
ls /var/lib/docker/containers/<container_id>/Each container gets its directory. Inside, you’ll find a file called container-id-json.log, which stores logs in raw JSON format. These can be read directly or ingested by log processors.
On Windows systems
dir "%programdata%\docker\containers"Windows uses a similar structure, but under the ProgramData directory. Each container has a folder, and logs are written to .log files. You can open them with Notepad or forward them to external tools.
Filtering and Searching Logs
When logs are too noisy to scroll through, filter them. These commands help you zoom in on the errors or events that matter.
Search for specific terms
docker logs container_name | grep ERRORPipe the logs through grep to find lines containing specific strings—like ERROR, Exception, or Timeout. This is useful when your app doesn’t have structured logging but prints useful messages to stdout.
Get logs from a specific point in time
docker logs --since 2024-03-19T13:00:00 container_idOnly shows log output from a given timestamp onward. You can also use --until it to cap the range. Helps when isolating logs during incident windows or post-deploy.
Real-Time Monitoring Tricks
When you're actively watching for something to break—or waiting for a specific message to appear—these tricks can help you stay on top of it.
Stream logs with timestamps
docker logs -f --timestamps container_nameThis adds a timestamp prefix to each line while following the logs. Handy when comparing logs from multiple services or matching events to other systems (e.g., cloud monitoring or alerts).
Use watch to re-run filters
watch -n 2 'docker logs container_name | grep ERROR'Runs the log filter every 2 seconds. This is useful when you want to monitor for recurring issues or new log entries matching a pattern, without needing to manually hit the up arrow and re-run your command.
Set Up Logging for MySQL and Node.js Containers
Not all containers log the same way. Databases, API servers, and background jobs each need slightly different setups to make sure logs are useful.
MySQL Container Logging
If you’re running MySQL in Docker, it’ll log a bunch of stuff by default. To keep it under control, here’s how to enable log rotation using docker-compose.yml:
services:
  mysql:
    image: mysql:8
    logging:
      driver: "json-file"
      options:
        max-size: "10m"
        max-file: "3"
This keeps logs from growing forever. Docker rotates them after they hit 10MB and keeps only the last 3 files. Enough to debug most issues, without clogging up disk space.
Node.js API Logging
For Node.js containers, logging is simple: write to the console.
FROM node:16

ENV NODE_ENV=production

CMD ["node", "server.js"]
As long as your app uses console.log() or console.error(), Docker picks it up. You’ll see those logs with docker logs <container>.
Don’t bother writing to files inside the container unless you’re pushing logs somewhere else; Docker won’t see them. If you're using a logger like Winston or Pino, just make sure it's configured to log to stdout.
Advanced Logging Configurations
If you're running containers at scale or just want tighter control over logs, you’ll need to tweak Docker’s logging behavior. Here's how to set limits, compress logs, and apply settings at the service level.
Set Global Logging Options with log-opts
You can configure default logging behavior for all containers by editing the Docker daemon config. This is useful if you want sane defaults across your system.
In /etc/docker/daemon.json:
{
  "log-driver": "json-file",
  "log-opts": {
    "max-size": "10m",
    "max-file": "3",
    "compress": "true"
  }
}max-size: Rotate logs after they hit 10MBmax-file: Keep only the last 3 log filescompress: Gzip old logs to save disk space
Restart the Docker daemon after changing this:
sudo systemctl restart dockerThis applies to all containers that don’t override the logging driver manually.
Logging for Docker Services
If you're using Docker Swarm and creating services, you can apply logging options directly when defining the service.
docker service create \
  --name myapp \
  --log-driver json-file \
  --log-opt max-size=10m \
  nginx
This works just like container-level logging, but for services. Handy when you're dealing with distributed workloads and want consistent logging behavior across all replicas.
Log Management Best Practices
Managing logs in Docker isn’t hard, but skipping the basics can lead to full disks, noisy alerts, and logs that are impossible to search. Here are a few ways to keep things clean and usable.
1. Rotate Logs Before They Become a Problem
By default, Docker stores all logs in a single file per container. That file grows until you stop it.
To avoid surprises, set a rotation policy:
services:
  app:
    logging:
      driver: "json-file"
      options:
        max-size: "10m"
        max-file: "3"
This setup keeps logs under control—rotating files after 10MB and keeping just the last three. It's simple and works well for most local or staging setups.
2. Secure Your Log Access
If you're using remote Docker hosts or sending logs across the network, enable TLS. It prevents unauthorized access and keeps your logs from being intercepted.
docker --tlsverify \
  --tlscacert=ca.pem \
  logs container_name
Also, watch what your app is logging. Avoid printing secrets, tokens, or full request payloads to stdout.
3. Centralize Logs for Production
For anything beyond local dev, you'll want to ship logs somewhere you can search them.
Example: use the Fluentd driver to forward logs to a centralized system:
logging:
  driver: "fluentd"
  options:
    fluentd-address: "localhost:24224"
    tag: "docker.{{.Name}}"
Once logs are centralized, you can plug them into Elasticsearch, Loki, or your favorite log viewer.
Useful Tools
You don’t need to wire up everything manually. A few tools can take the heavy lifting out of log collection and routing:
- Logspout: A Lightweight tool that forwards Docker container logs to syslog, Fluentd, or any remote log endpoint.
- Fluentd: A flexible, production-grade log collector. Works well with Docker and supports filtering, buffering, and output to multiple backends.
- Last9: A modern observability platform built for high-cardinality metrics and containerized environments. You can ship logs, metrics, and traces directly from your Docker workloads to get better visibility into what’s breaking.
Quick Fixes for Logging Issues in Containers
Containers fail. Logs go missing. Commands don’t behave the way you expect. Here’s a quick checklist to help you figure out what’s going on when things break.
The container isn’t logging anything?
- Make sure the app is writing to
stdoutorstderr. - If it's logging to a file inside the container, Docker won’t capture it.
- Check if a custom logging driver is set with
docker inspect.
Logs are huge or missing older entries?
- You probably don’t have log rotation configured.
- Use
max-sizeandmax-filein your logging config to prevent disk bloat.
Can’t find logs after a container crash?
- Run
docker ps -ato confirm the container still exists. - Then run
docker logs <container>—logs persist even after the container exits (unless it's removed).
Logs missing timestamps?
- Add the
-tflag:docker logs -t <container>. - Or use a logging tool that adds timestamps automatically.
Log spam making it hard to debug?
- Use
docker logs --tail 100to get only recent output.
Pipe logs through grep to filter:
docker logs container_name | grep ERRORMultiple containers, no clue what’s happening?
- Use
docker compose logs -fto stream logs from all services. - Narrow it down with:
docker compose logs -f api db
Tail and fix Docker log issues faster — right from your IDE, using AI and Last9 MCP.


Docker Logs with Last9
Digging through logs using docker logs works for local debugging, but it doesn’t scale. If you’re running multiple containers across environments, you need a better way to store, search, and make sense of your logs.
Last9’s log analytics gives you a centralized view of logs from all your containers, with support for filtering, querying, and correlating them with metrics and traces.
Instead of tailing logs across multiple shells, you can:
- Query logs by container, service, or tag
- Filter by error type or status code
- Correlate logs with alerts and incidents
It’s a faster, more reliable way to debug production systems, especially when things break across multiple services at once.
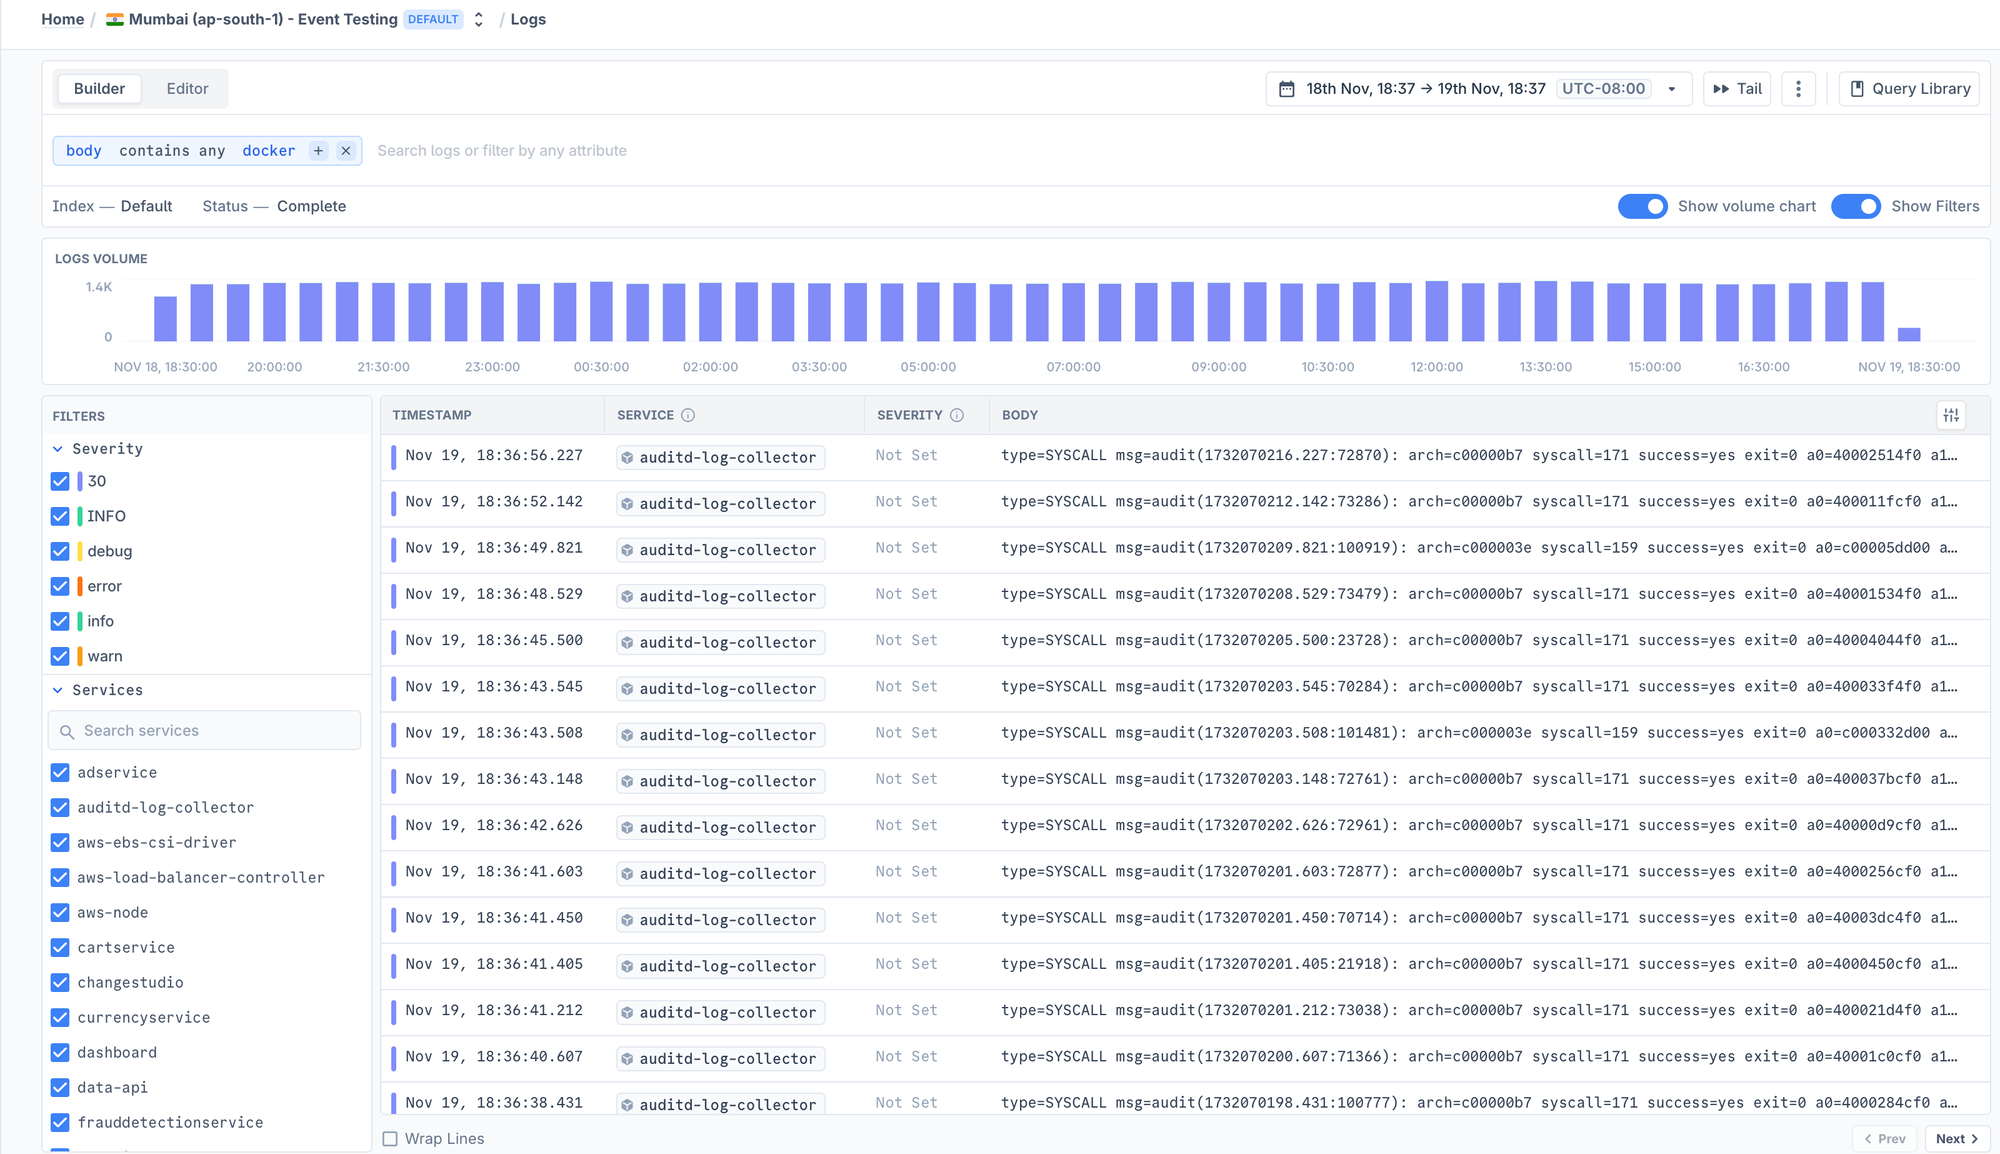
You can also do tail in the UI to make this easy without having to do anything through the command line.
Summary
Mastering Docker logs takes time, but it’s worth it. Debugging one container is tough enough; doing it across a bunch of services without proper logs is a mess.
Here’s what helps:
- Use structured logs wherever possible
- Set up log rotation early
- Keep an eye on how fast logs grow
- Don’t log sensitive stuff in plain text
- Pick a logging driver that fits your environment
These small changes can save hours of chasing broken containers in the middle of an incident.
FAQs
Where are Docker container logs stored?
Docker writes logs to a container-specific file, depending on your OS and log driver.
- Linux/Unix:
/var/lib/docker/containers/<container_id>/<container_id>-json.log - Windows:
%programdata%\docker\containers\<container_id>\<container_id>-json.log
How do I clear Docker logs?
You can either set up log rotation or clear logs manually.
- Rotate automatically:
{
  "log-driver": "json-file",
  "log-opts": {
    "max-size": "10m",
    "max-file": "3"
  }
}- Truncate the log file manually:
truncate -s 0 $(docker inspect --format='{{.LogPath}}' container_name)How do I clear Docker logs without deleting the container?
Use truncate to wipe the log file while keeping the container running:
truncate -s 0 /var/lib/docker/containers/<container_id>/<container_id>-json.logThis is safe, but make sure the container is used with the json-file driver.
How do I check logs for a specific container?
Use the docker logs command:
docker logs container_nameAdd -f to follow logs live, or --tail to limit output:
docker logs -f --tail 100 container_nameCan I view logs from all Docker containers?
Yes. If you’re using Docker Compose:
docker compose logs --followFor non-compose environments, tools like logspout or fluentd are better for aggregating logs across containers.
How do I get logs for a specific time range?
Use the --since and --until flags:
docker logs --since 2024-06-01T12:00:00 --until 2024-06-01T14:00:00 container_nameYou can also use relative time:
docker logs --since 2h container_nameWhy is my container not logging anything?
Common reasons:
- Your app writes logs to a file instead of stdout/stderr.
- A custom log driver (e.g.
none) is active. - The container exited before logs were flushed.
Check with:
docker inspect container_name | grep LogPathHow do I add timestamps to Docker logs?
Use the -t flag:
docker logs -t container_nameThis adds an ISO 8601 timestamp to each log line.
Can I grep through Docker logs?
Yes, just pipe output to grep:
docker logs container_name | grep ERRORFor live filtering, combine with watch:
watch -n 2 'docker logs container_name | grep ERROR'How do I forward Docker logs to an external system?
Set the container’s logging driver to something like fluentd, syslog, or awslogs:
logging:
  driver: "fluentd"
  options:
    fluentd-address: "localhost:24224"
    tag: "docker.{{.Name}}"
What are the best tools for managing Docker logs?

