

Anomaly detection & change intelligence for high-cardinality environments
An end-to-end alerting tool built to tackle high-cardinality use cases. Designed to reduce alert fatigue and improve Mean Time to Detect.

Core tenets of Last9 Alerting, from the ashes of countless RCAs.
Monitoring tools watch your stack. But who watches your monitoring?
Alert Studio exposes the runtime metrics of the alert evaluation engine to the user, bringing in accountability and transparency.
Not able to get the big picture due to multiple siloed tools?
Alert Studio helps identify trends in infra, app, and business metrics. It correlates config & environment changes impacting system health.
Are false, noisy, and stale alerts destroying alerting effectiveness?
IaC and GitOps workflows streamline alert setups, while Anomalous Pattern Detection tackles false positives arising from static thresholds.
Open Standards and PromQL compatible, but with super powers.


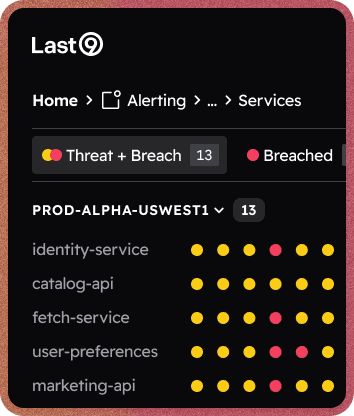
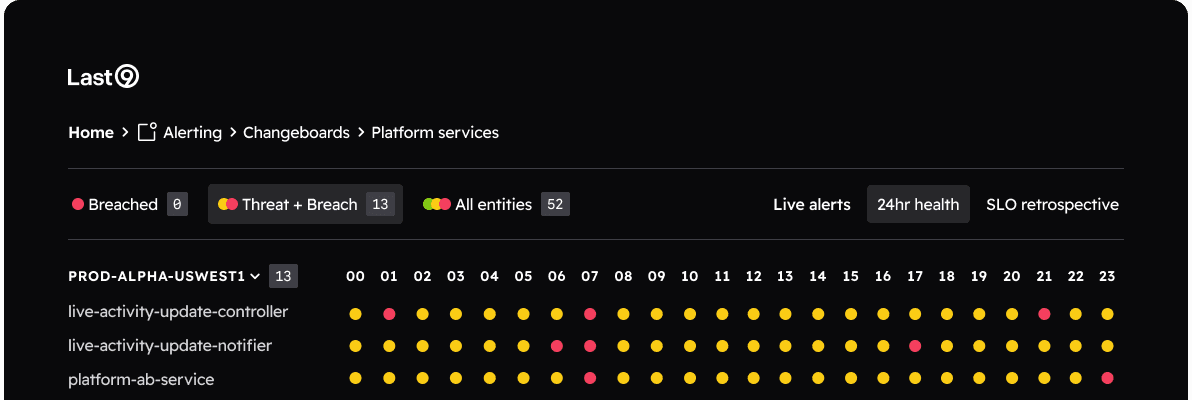
Change intelligence
- Changeboards: A simple view that gives a correlated timeline of system health.
- Change Events: Captures changes such as deployment & configuration changes, notify special calendar events.


Anomalous pattern detection
- Reduce alert fatigue due to innumerable static thresholds used in setting alert rules.
- Detect spike changes, loss of signal, baseline deviation and noisy neighbors using our Anomalous Pattern Detection Guide.


Agile configuration management
- Automated workflows with Infrastructure as Code (IaC) tool for managing alert configurations.
- Component auto discovery.
- Version history and peer review of configurations using GitOps.
- Programmatic configuration with Python SDK and first class API.
Automation, automation, automation. That's how we work at Probo and Last9's alerting just fits like a glove into that workflow. Reliable, easy to integrate, and exceptional customer support.
Aditya Chowdhry
Platform Lead
Learn more about the product
A first-class experience for a single pane of glass. End-to-end telemetry management to control your observability data and its costs.
Gain real-time insights into performance issues and root causes by correlating traces with logs, metrics, and events in a single pane.
Stream, store, and analyze millions of logs per minute without worrying about things breaking, including your bank account.
Never compromise on high cardinality metrics data again just because your observability tool could not handle them.

Start observing for free. No lock-in.
Just update your config. Start seeing data on Last9 in seconds.
We've got you covered. Bring over your dashboards & alerts in one click.
100+ integrations. OTel native, works with your existing stack.