Fully Managed Cloud Hosted Prometheus
Hosted & Fully Managed Prometheus compatible monitoring solution, with superior alerting capabilities, higher retention and built-in Grafana
Levitate is highly available cloud-native monitoring solution, built with support for high cardinality and long term metric retention.
Levitate is OpenTelemetry and Open Standards compatible, eliminating vendor lock-ins.
“Levitate stood the test of scale, accuracy, and real-time monitoring with our growing business. Using High Cardinality workflows from Levitate, we accurately measured customer SLAs across dimensions such as geo region and channels. We could extract knowledge about our systems and measure customer impact proactively in real time using Levitate.”
Ranjeet Walunj (Via G2 Review)
How is Levitate different from other Managed Services for Prometheus?
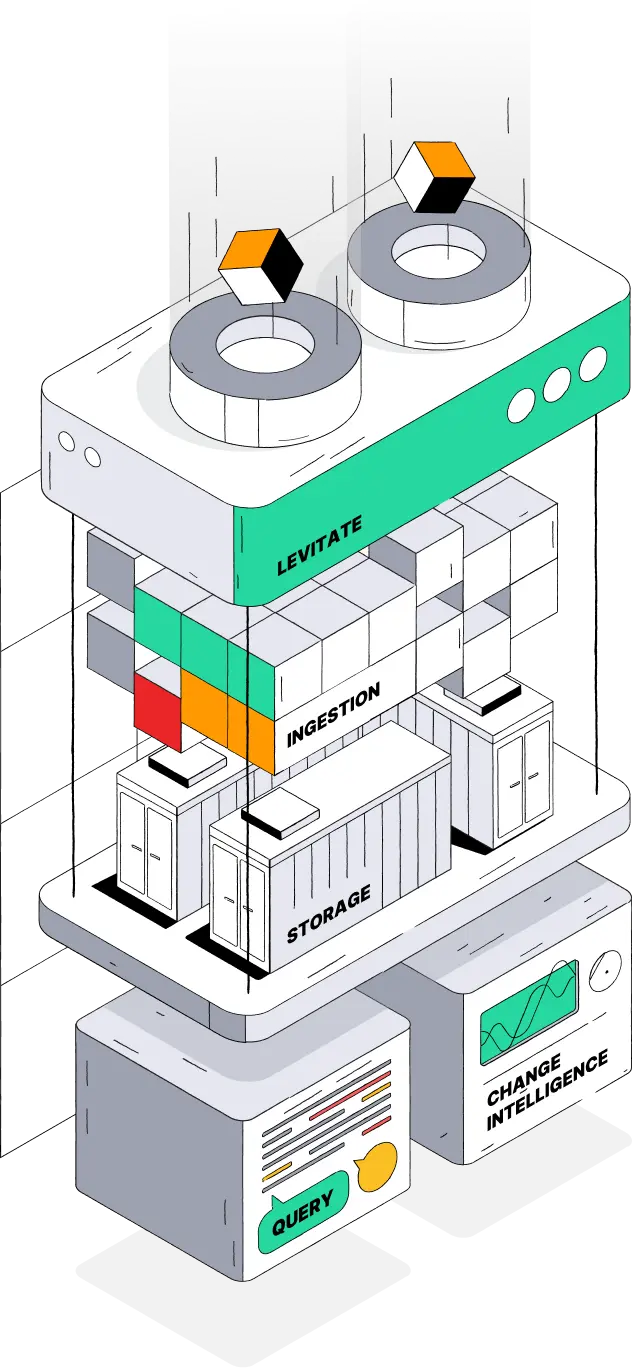
Levitate is built with warehousing capabilities baked-in to mitigate the problems of high cardinality, concurrent access, high availability, long term metric storage with fast query performance, and proactive alerting.
While other hosted Prometheus providers only offer vanilla Prometheus capabilities, Levitate is a cloud monitoring & observability solution with alerting, hosted Grafana and a highly scalable Time Series Database. Focus on what matters, without blowing up costs.
Learn how Levitate reduces 50% of your observability and monitoring costs.


- Cardinality Limiter
- Concurrency Limiter
- Streaming Aggregation
- Blaze Tier
- Cold Tier
- No Downsampling
- Access Tokens & Policy
- Client Separation
- Query Acceleration
- Familiarity of PromQL
- Democratization of alert rules
- Cardinality Limiter
100% Prometheus Compatible With Control Levers of a Warehouse
Levitate comes with default control levers that help reduce costs. These levers are four-fold:
- Data Tiering
Automatic data tiering avoids latent dashboards, and keeps queries across teams blazing fast. - High Cardinality
Solve for cardinality at the ingestion layer to reduce storage & costs, using Streaming Aggregations. - Client Separation
Control which tier can serve alertmanager queries and Grafana workloads, using access tokens and policies. - Concurrency Control
Limit the active number of queries the tier can handle simultaneously.
Bring Your Own Cloud
With the Bring Your Own Cloud (BYOC) deployment model, Levitate is deployed in your Cloud, or on-premise.
Save costs in three categories:
- Customers can retire their Enterprise Discount Program (EDP) commitment when applicable, massively reducing infra costs.
- Zero Egress costs and no worries about overages.
- Purchase Levitate from AWS or Google Cloud Marketplaces to ease procurement, avail cloud credits and discounts.
Additionally, data never leaves your infrastructure, solving compliance & regulatory concerns.
“Levitate has greatly improved our operations at Hotstar, allowing us to focus on providing live sports and entertainment to our customers. It has eliminated the need for tedious metrics database management tasks and is an essential part of our observability efforts.”
Superior SLAs with Clawbacks
We’re committed to providing a managed offering that goes above and beyond current industry offerings. That’s why we back up our offerings with Service Level Agreement (SLA) guarantees and clawbacks for both Read and Write workloads.
By being a fully managed platform, Levitate takes away the toil of running and managing an in-house cloud native monitoring system at scale.
Cloud Monitoring & Alerting at no extra cost
While other hosted Prometheus providers only offer vanilla Prometheus capabilities, Levitate is one-stop cloud monitoring & observability solution with superior alerting, hosted Grafana and a highly scalable Time Series Database.
No extra cost of running a managed Grafana or alertmanager.
More than just a Managed Service for Prometheus
Long Term Metric Retention
Solve your Prometheus retention challenges with Levitate. Data retention with up to a year without any rollups are supported by default using automatic data tiering.
High Cardinality Metrics
Are you hitting Prometheus cardinality limits? Never compromise on metric & label cardinality with Levitate. Control your data growth with streaming aggregations, and get early warnings on label & metric cardinality data explosion.
Fast Query Performance
Speed up queries without racking up on Prometheus infrastructure costs while supporting concurrent client access with Levitate's access policies. Delta caching and tiered reader make sure that query performance is maintained even with data growth.
Custom Metrics Support
There is no extra billing for Custom Metrics like Datadog and other managed services for Prometheus providers. Supports all types of custom metrics via agents and manual instrumentation. Levitate is a single source of truth for all metrics such as application, infra, and business.
Managed Grafana
Levitate comes with in-built free Managed Grafana, which is part of Last9's complete Cloud Native Monitoring stack—no need to pay extra for Grafana like other Managed Prometheus Services.
Alerting and Notifications at no extra cost
While other managed prometheus providers charge you extra for running Prometheus alertmanager, Levitate has built-in, highly scalable alerting support with seamless import capabilities from your existing Prometheus alerting YAML.
Available on AWS and GCP Marketplace
Ease your monitoring tools procurement with Levitate on AWS Marketplace and Google Cloud Marketplace. Reduce your observability cost, retire your EDP credits early, and eliminate your billing hassles.
Bring Your Own Cloud
With the Bring Your Own Cloud(BYOC) deployment model, our fully managed Cloud Native Monitoring stack is deployed in your cloud or data center. Leverage cloud credits and discounts to nullify your Prometheus infrastructure costs.
On-Premise Support
Don’t leave the comfort of a Prometheus on-prem deployment with Levitate’s BYOC deployment. We support fully managed deployment in your on-premise environment and data center—no compliance and regulations challenges. Data always stays near your infrastructure.
High Availability
With horizontally scalable, replicated, multi-AZ architecture, Levitate provides HA out of the box eliminating challenges with Prometheus High Availability and Federation.
Open Source Data Collectors
No proprietary agents for collecting data. Levitate supports open standards — OpenMetrics, OpenTelemetry, and integrates with open-source tools such as Prometheus, VictoriaMetrics, InfluxDB, Telegraf, and StatsD.
Cloud Native Monitoring
Built for scale and reliability of today's cloud-native workloads without compromising cost. High Cardinality and Data Tiering Control levers avoid sticker shock.
Use Cases
Infrastructure Monitoring
Monitor cloud infra without worrying about data growth with Levitate. Support hybrid cloud monitoring with AWS Cloudwatch using AWS Kinesis Firehose stream and GCP Stackdriver integrations. One year of long-term retention allows for understanding infrastructure changes over time and capacity planning.
Application Performance Monitoring (APM)
Monitor application performance with Levitate using open standards-based agents with in-built APM Grafana dashboards and alerting rules. Compare application performance across tenants, teams, and services.
Kubernetes Monitoring
Monitor the health of Kubernetes-based Cloud Native setups using Streaming Aggregations to manage data growth. Slice and dice different high cardinality labels without losing out on visibility into your Kubernetes clusters.
CloudWatch Monitoring
Never pay again for Cloudwatch read queries. Instead of using the CloudWatch Metric Stream, make Levitate a source of all AWS Cloudwatch metrics. Leverage built-in Grafana dashboards for simplified and seamless CloudWatch Monitoring.
Real Time Monitoring
With Alerting working on top of Levitate's optimized Query Engine, real-time monitoring gets unlocked. Concurrent access of time series data gets solved by client separation between Alerting and visualization using Grafana.
Business Metrics
Levitate's full stack monitoring capabilities allow capturing high precision business KPIs and monitoring them along with application and infrastructure metrics.
60% cost reduction over Google Cloud Managed Service for Prometheus.
Start your monitoring journey today with Levitate — a fully managed, Prometheus and OpenTelemetry compatible Time Series Data Warehouse.
Frequently Asked Questions
What are the supported regions for Levitate's managed service for Prometheus?
Levitate is globally available across different regions such as North America(us-east-1), APAC India(ap-south-1), APAC Singapore(ap-south-east-1), Europe(eu-west-1). Levitate also supports AWS PrivateLink and VPC peering to eliminate egress costs. The BYOC deployment model applies to all regions.
How do I migrate from self-hosted Prometheus or other Managed Prometheus provider to Levitate?
Levitate needs no complex migration. Levitate is compatible with Prometheus Remote Write API. Create a Levitate Cluster and start writing to it using Prometheus Remote Write from your existing setup within minutes. Once you are satisfied with Levitate, eliminate Prometheus storage and compute if you are using self-hosted Prometheus.
How do I collect metrics data and send it to Levitate?
Levitate supports open standards — OpenMetrics, OpenTelemetry, and integrates with open-source tools such as Prometheus, VictoriaMetrics, InfluxDB, Telegraf, and StatsD. Additionally, it can also collect metrics from AWS Cloudwatch Stream via OpenTelemetry-based Kinesis Stream integration. It can accept metrics from OpenTelemetry Collector and various other ways using Prometheus Remote Write. No need to run proprietary agents or data collectors.
Can I monitor CloudWatch using Levitate?
Yes. Monitoring Cloudwatch using Levitate has one distinct advantage over monitoring using Cloudwatch itself. Cloudwatch charges for accessing its read API. Levitate leverages the AWS Cloudwatch metric stream integration, which streams metrics from AWS to Levitate, which does not result in increased AWS Cloudwatch Bill.