Aug 18th, ‘23/6 min read
Understanding the Rasmussen model for failures
What does the Rasmussen model teach us about Site Reliability Engineering?
There’s no such thing as a foolproof system. Systems, by design, operate at capacity. The nature of engineering is to eke out more from a system than what it delivers. By virtue of engineering pushing the acceptable boundaries of a system, failures occur. This is inevitable, and that’s also the joy and perils of engineering — discovering the acceptable limits of system resilience.
A framework to understand this beautiful dichotomy between a system and its human endeavor is the Rasmussen Model. The Rasmussen model is applied to many fields and is particularly noteworthy in cognitive psychology. But this model also presents a compelling analysis of how to think of Site Reliability Engineering.
What is The Rasmussen Model
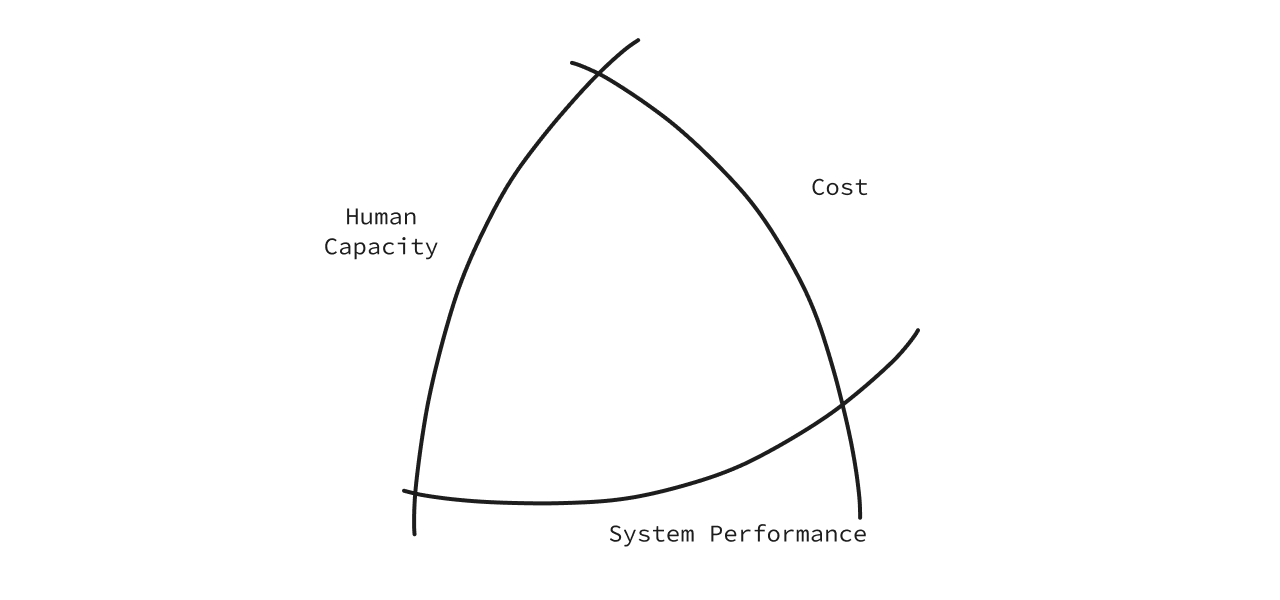
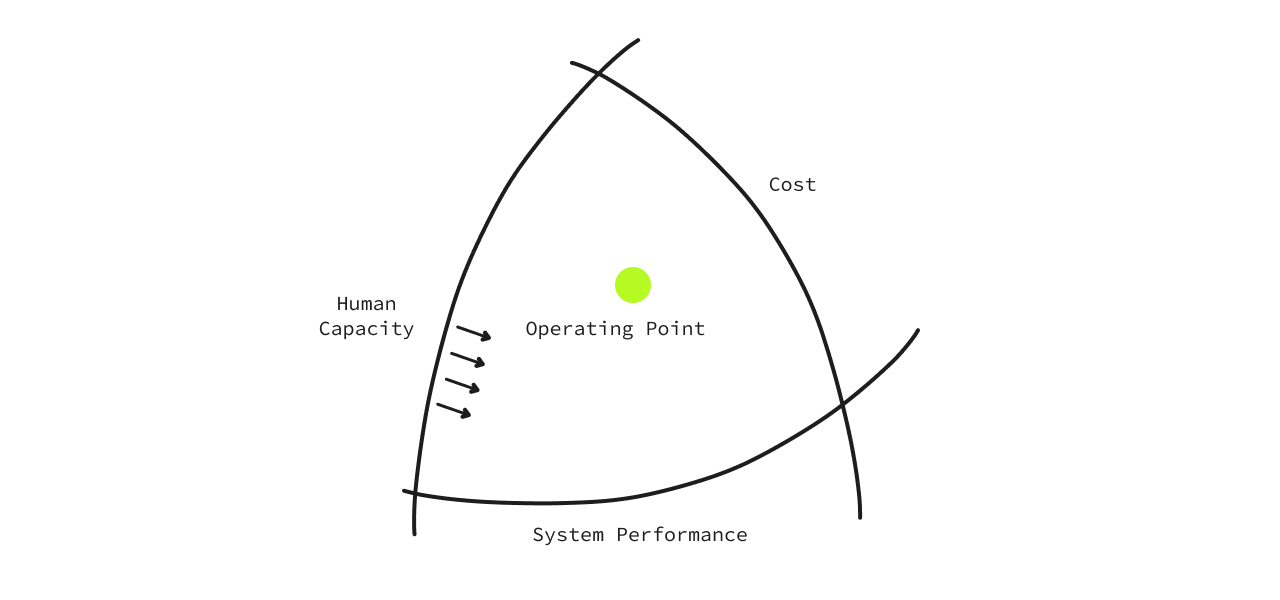
The Rasmussen Model describes three boundaries to explore the dynamics of a safety system subject to pressures for performance improvement. The model is used to study how to build safety in critical power plants and also extrapolated to understand how an organization functions. Let’s take the example of an organization to understand this.
There are boundaries to performance in any organization. If those boundaries are pushed, everything collapses. But what are these boundaries?
There are three we can summarise:
- Cost
- System Performance
- Human Capacity
These three form the organizational construct of acceptable limits. Let’s understand them:
1. Cost
Every business needs money to run. Let’s put a boundary to it. If we exceed this boundary, the business is not viable anymore, and it doesn’t make sense to run it.
2. System Performance
A system has defined limits. They have a finite ability to take work. If we exceed this capability, the system crashes and is unable to perform its set, defined duties.
3. Human Capacity
Businesses need humans. Different humans come with varying degrees of performance. For example, some naturally exhibit high agency, while others are listeners and do work assigned to them. There are limits to the performance of each human — capabilities, agency, etc…
At the center of these three is where the business exists. Let’s call it the ‘Operating point'. A business operates within these three boundaries, and pushing any particular boundary over the other would create an imbalance in the structure.
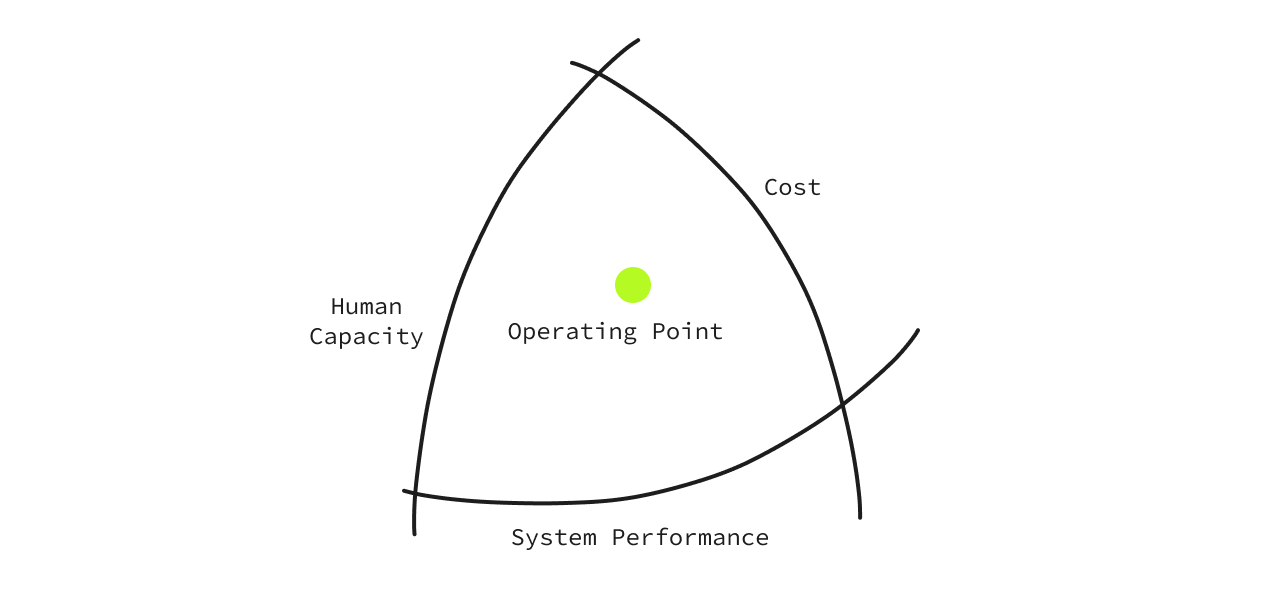
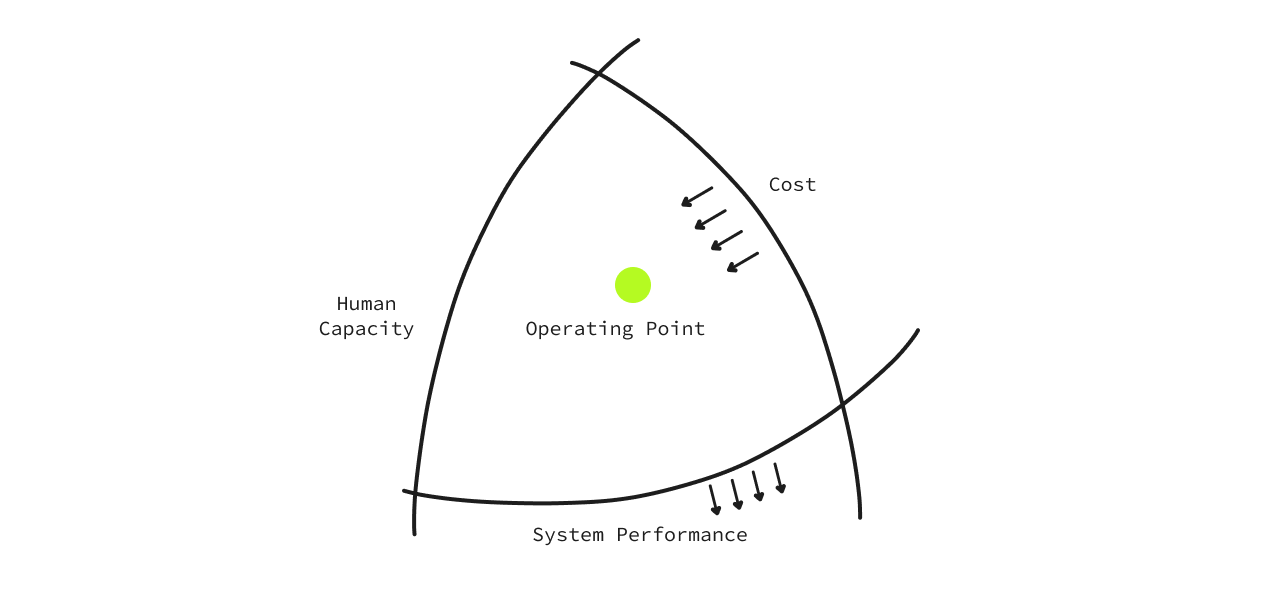
For example, money is always a constraint, and when those constraints are pushed inwards, it comes at the cost of pushing the ‘System Performance’boundary outwards. This tends to stress the ‘Human Capacity’ boundary. Every organization has to make implicit trade-offs and important calls to map out their acceptable boundaries.
Let’s understand this with an example from the ‘Human Capacity’ angle:
Humans operate in the exact opposite spectrum of how a business would. We want to get the most performance with the least capacity. So, the boundary of ‘Human Capacity’ is to always instinctively move inwards. This is why we tend to automate things and maybe take shortcuts. This is instinctive. We want to get more with the least effort - so we can do more.
But, this endeavor forces us to make mistakes. It stresses the boundaries of ‘System Performance’. In our pursuit to be efficient, mistakes are a given. Without mistakes, we simply can’t move forward. It’s the very nature of innovation, riddled with mistakes, experiments, and work that may not necessarily be successful. But this teaches us and puts us on a path to success.
Here’s another example of this. When an incident happens (a system breaks), the operating point has crossed a boundary. Let’s say latencies have risen in your application.
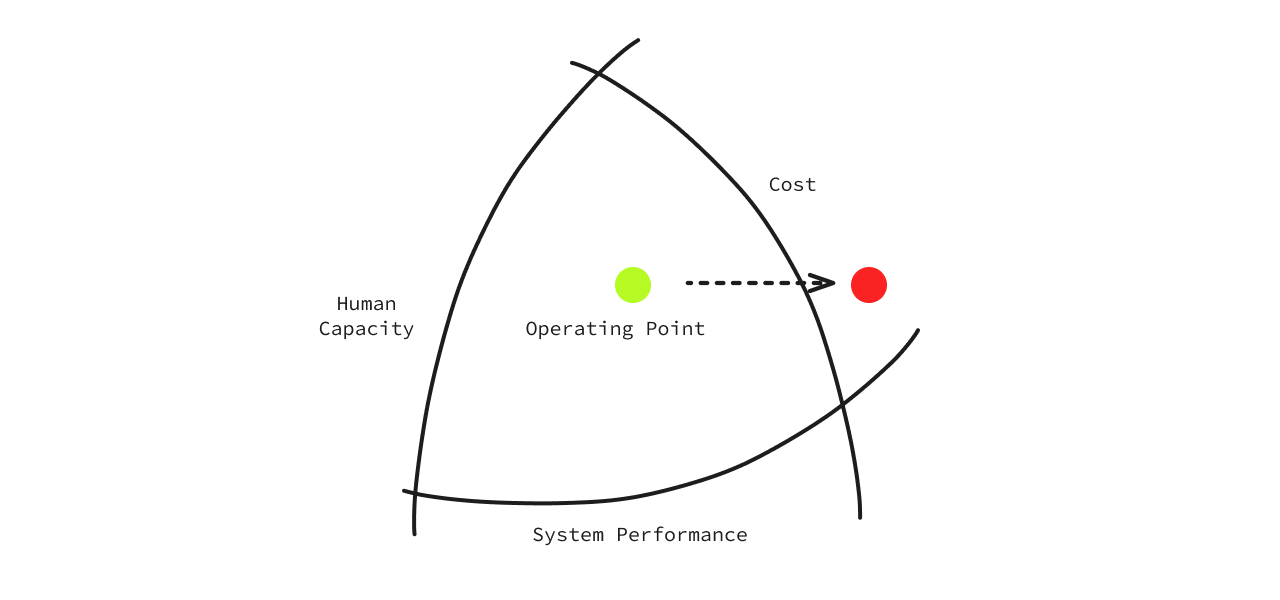
To recover, we:
- Add more EC2 instances = increase System Performance, or
- Add more people = increase Human Capacity
- This results in the Cost going beyond an acceptable limit.
See how each boundary is dependent and intertwined?
Normalisation of Deviance
Every organization has an acceptable boundary limit.
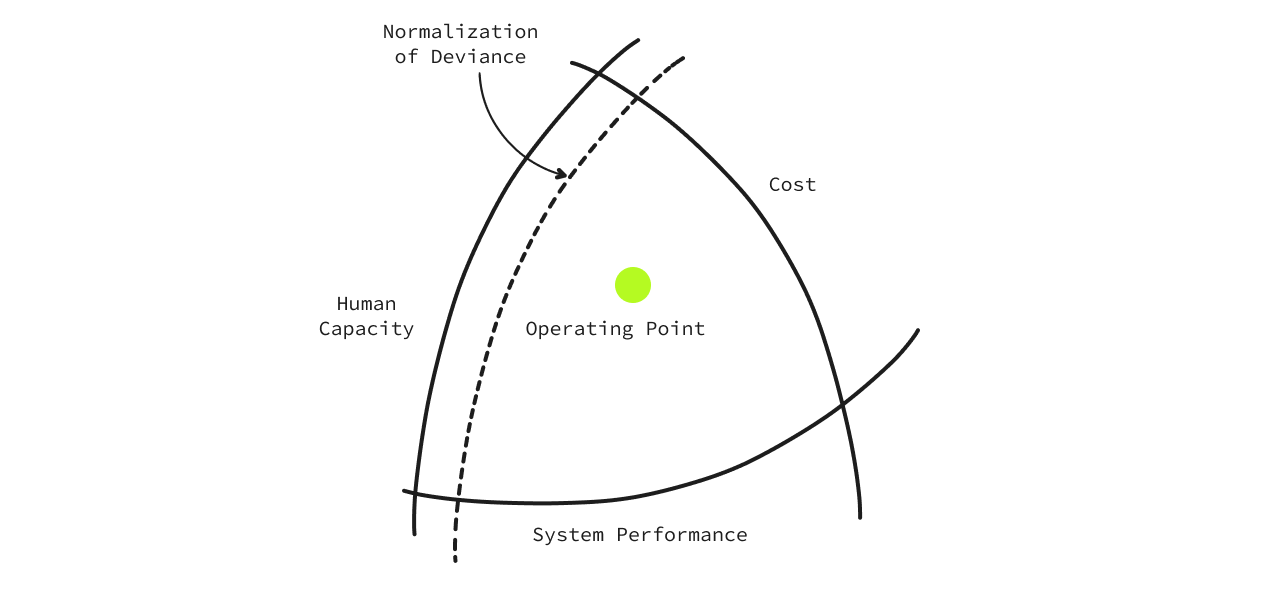
The only way to understand the acceptable boundary limits of performance failure is to push its boundaries. To know something matters, you first have to measure it 😉. Simply put, organizations tend to make grave mistakes that teach us what an acceptable boundary is.
In the image below, it’s termed ‘Normalization of Deviance’. 👇
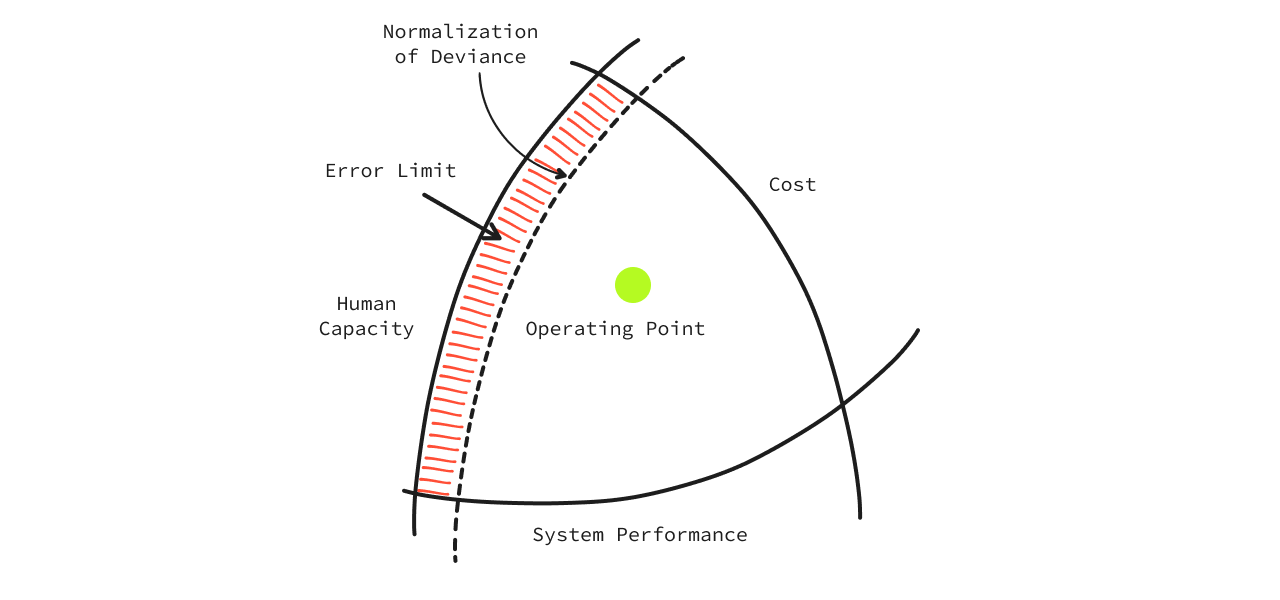
The ‘Error Limit’ is the margin of difference between the ‘Human Capacity’ boundary and the ‘Normalisation of Deviance’. This is where management plays an important part — pushing the Normalisation of Deviance from time to time but not breaking the Human Capacity. The better the management manages this boundary, the stronger it is in getting the best from its people without breaking them, saving costs, and reducing mistakes.
What does this mean for Site Reliability Engineering?
There’s an untold saying in the Observability world.
Bait em first, then bill em for ignorance
Let’s take the Rasmussen model to understand its relevance in SRE.
Observability is about costs. Things have gotten so out of hand that it’s imperative to control costs. Every organization I’ve spoken to first wants to solve spiraling costs. Building ‘Reliability’ mandates with strong control levers comes next. That’s the hard truth of the status quo. But why?
Well-funded organizations have resorted to throwing money at the o11y problem, from hiring more, to building more microservices to spinning up unwanted servers. But systems don’t work like that. You can’t simply throw money at the problem and make it disappear. Just like more engineers, ≠ better code, more money ≠ better Reliability. But, by doing so, problems compound.
Companies have now recklessly taken the microservices route and have more observable entities. More observable entities mean more people to monitor these services. This creates an unending loop of toil to manage your Time Series Database (TSDB) and all the visualization and alerting that comes with it.
As an SRE, you’re now tasked with controlling costs, reducing toil, and getting optimal system performance. Getting the best from the system has constraints around spending money and human capacity. One cannot ignore the limitations of both these fungible components.
Ok, what does this mean?
The CTO of an engineering organization needs to define what the Normalisation of Deviance line is. This comes with accepting failures and understanding budgets and the error rates under which one can operate.
Another way to look at this is to hard constraint some key metrics to analyze the performance of your SRE team:
- What have been the cost reductions YoY, or QoQ
- What’s the Mean Time To Recovery (MTTR) YoY, or QoQ
- What has been the Mean Time To Detect an issue, and what is the human involvement around this?
- The cost of engineering overheads (money on salaries, office space, support staff et, al.) and the toil from the team to manage an entire o11y tool - from storage, compute, visualization, alerting et, al.
These 4 points teach us the Total Cost of Ownership around Observability. This needs to be tracked in cost terms and monitored. If an organization is not improving this, you’re abetting the worsening of a cost center.
The Rasmussen model buckets this entire thinking by giving leaders a framework to bring in more accountability in an organization.
P.S. These 4 points are not exhaustive but a mere indication of how to practically apply this theory. The fundamentals are the same; its practical implications can be implemented based on how a leader aims to cut costs. And I think the current tech arctic winter will force more organizations to rethink their infrastructure costs.
I'd love some opinions and thoughts on this post. For folks who have a contrarian take, my DMs are open on Twitter - @nishantmodak ✌️
Contents
Newsletter
Stay updated on the latest from Last9.
Handcrafted Related Posts

Streaming Aggregation vs Recording Rules
Streaming Aggregation and Recording Rules are two ways to tame High Cardinality. What are they? Why do we need them? How are they different?
Last9
Building Logs to Metrics pipelines with Vector
How to build a pipeline to convert logs to metrics and ship them to long term storage like Levitate
Aniket Rao
Observability - That Last 9
TL;DR: A stitch in time, saves 9. A discussion on the key blocks of observability.
Akash Saxena