Mar 8th, ‘24/4 min read
Software Monitoring — Stuck in the 00s
A short history of software monitoring, from the 00s. What has changed? Why are things so arcane?

The one field in engineering that’s still stuck to the primitives of the 2000s:
Software Monitoring.
The user experience that matters increasingly at Endpoint Devices continues to be improved by Edge computing & distribution. However, the measurement of service quality is still done using server-based primitives.
This is how our 00s were:
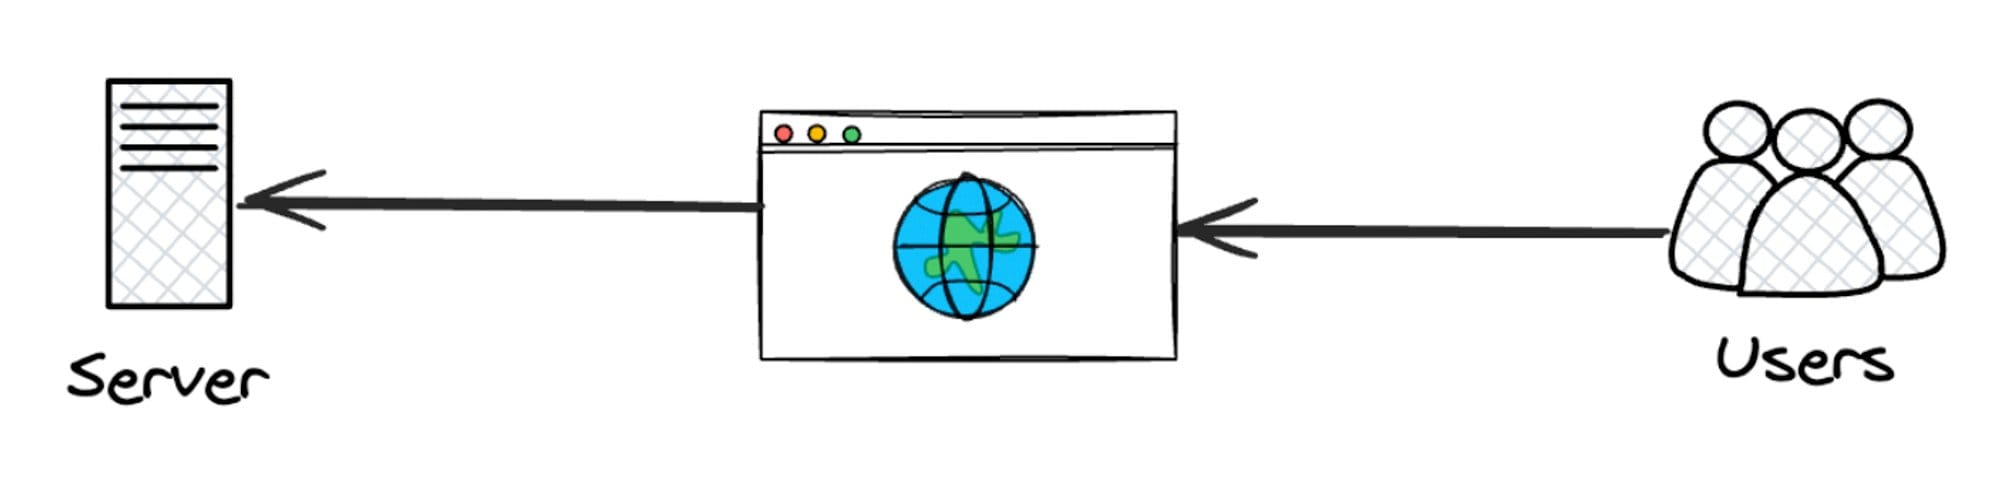
Users access the web through a browser. The internet was sluggish and unreliable, so a broken experience didnʼt result in lost customers. Things chugged along.
By the late 00s, mobile phones came about. This changed everything, and fast.
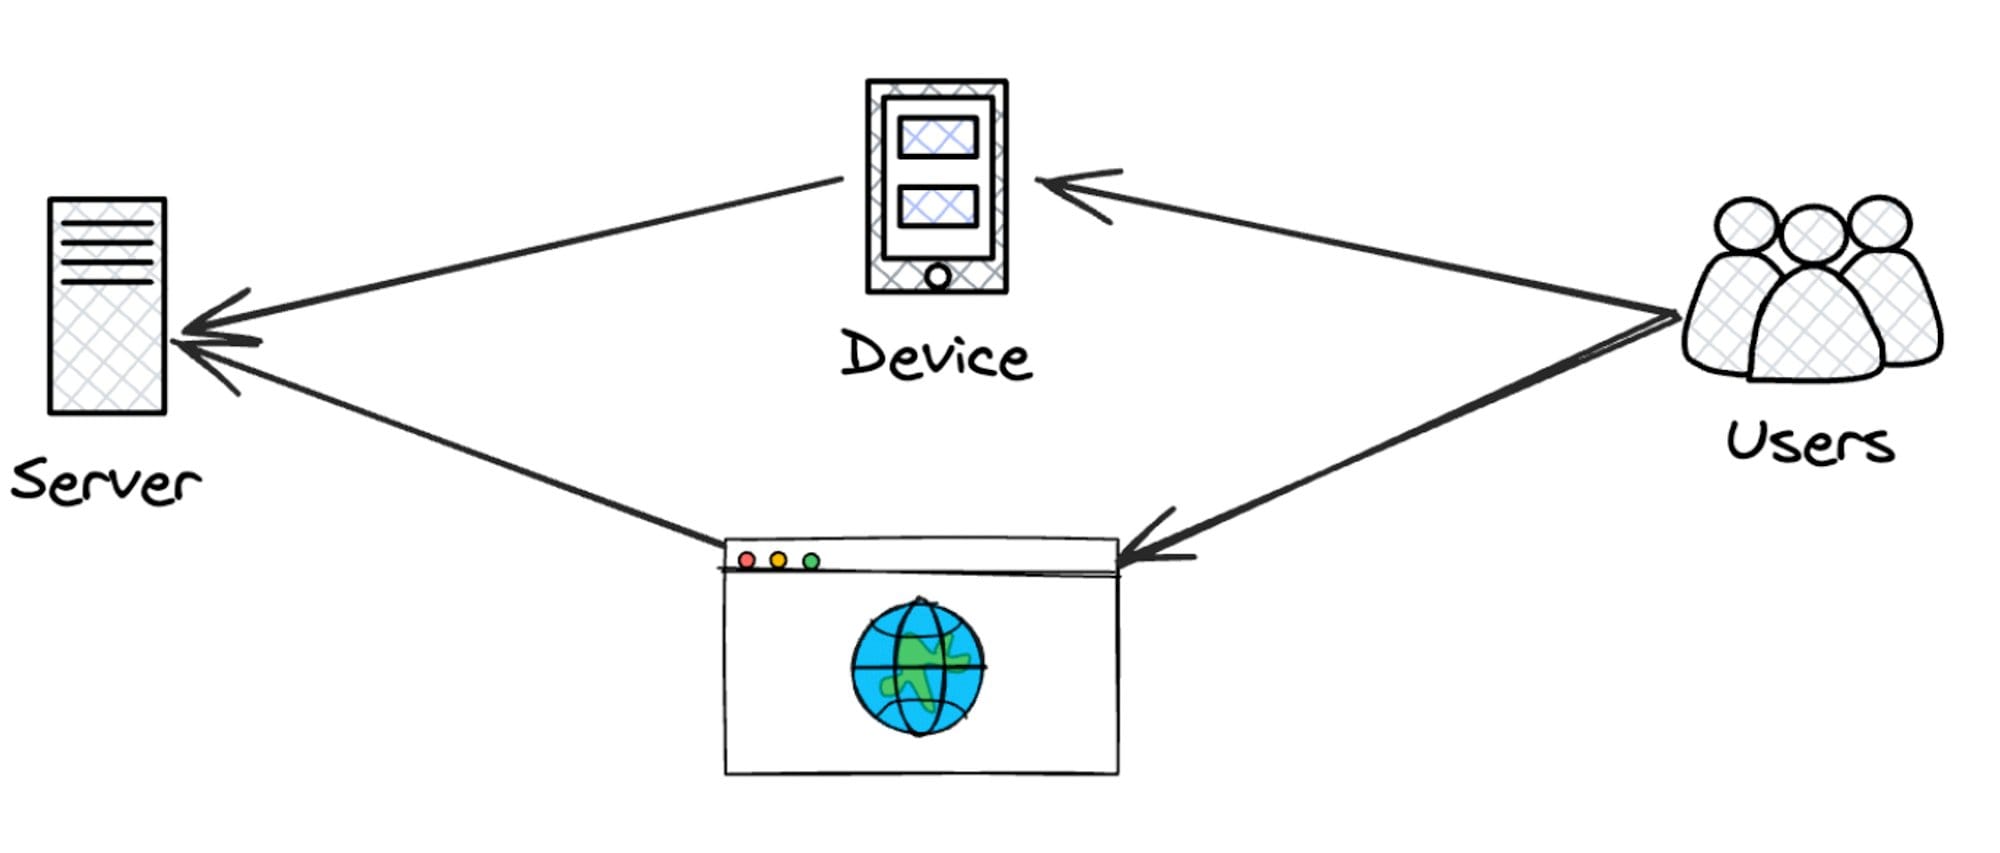
The attention spans of a user’s actions are reduced to' time-between-elevators' and ‘time-between-coffee breaks.’ This meant users demanded more. Attention spans dwindled. Apps started satiating dopamine hits. And latency was unacceptable.
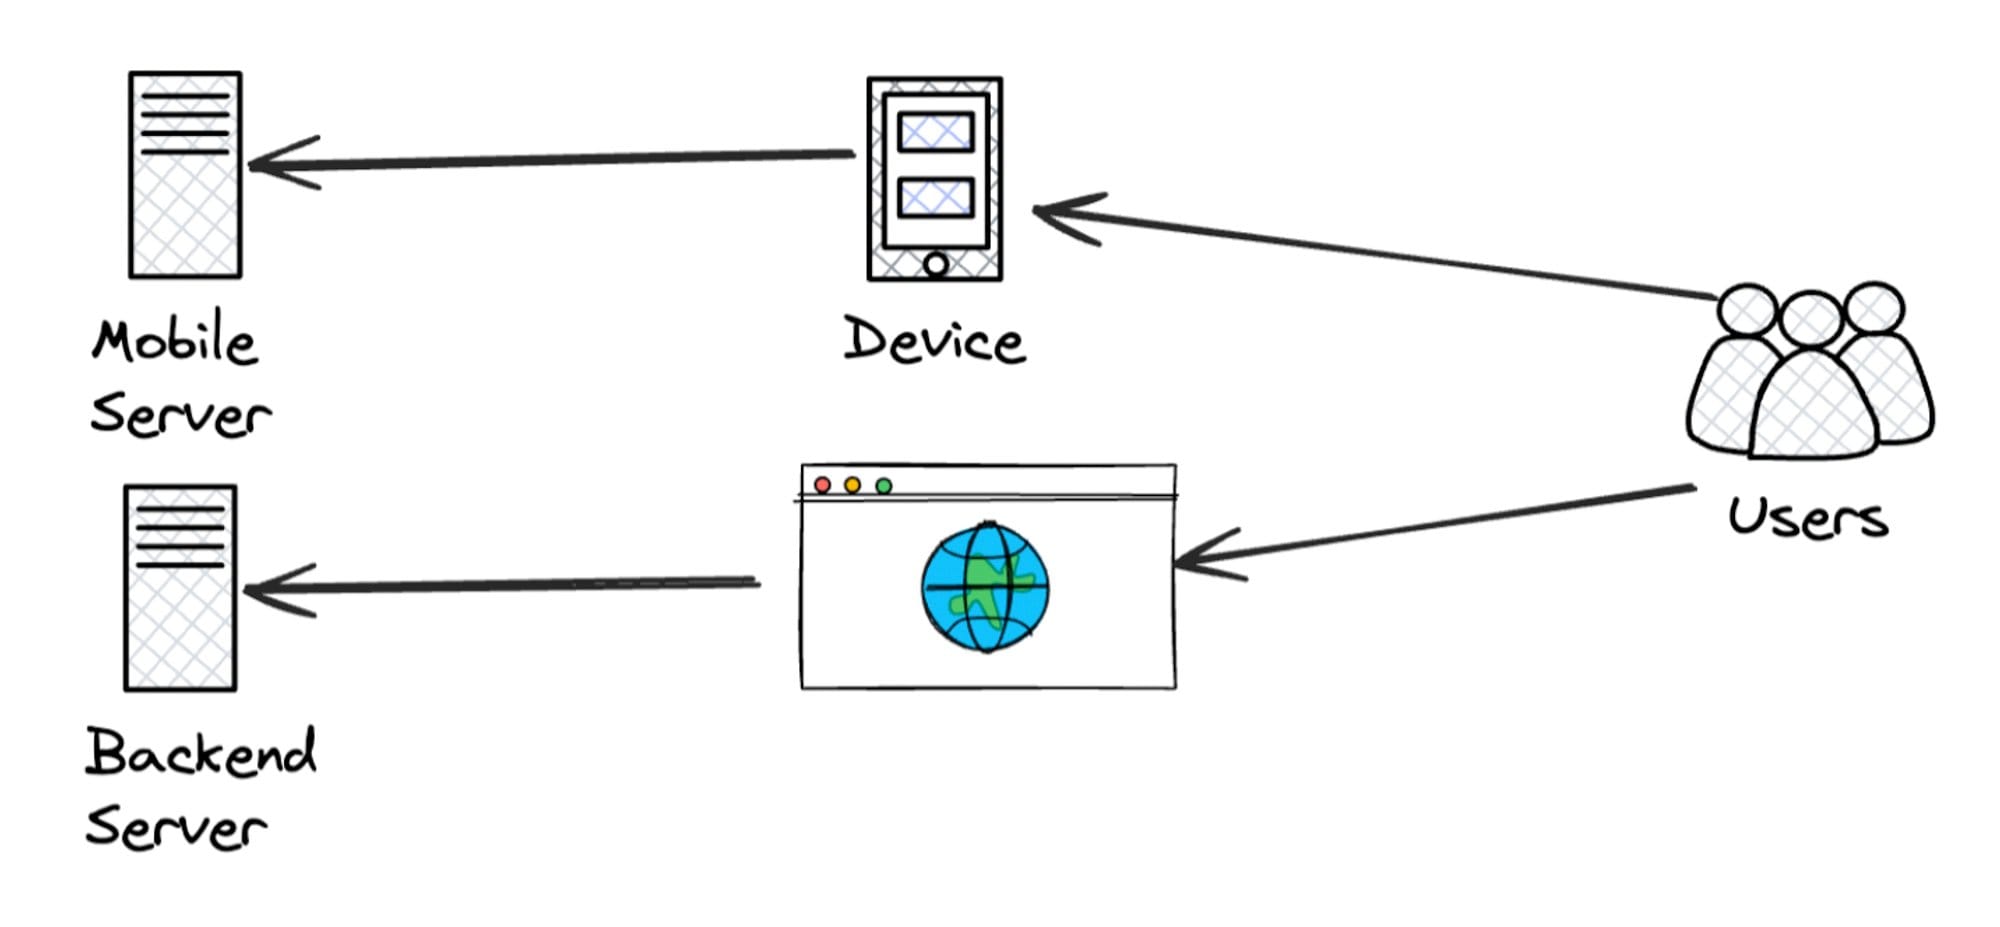
Software and business started getting serious about distributed systems. There was no other way to satiate the rise of a ‘give-it-to-me-now’ user.
The first services to take advantage of this were media services, which aimed to reach customers quickly for faster consumption.
Content Delivery Networks (CDNs) and edge media became widely adopted. Users could now upload and download files quickly.
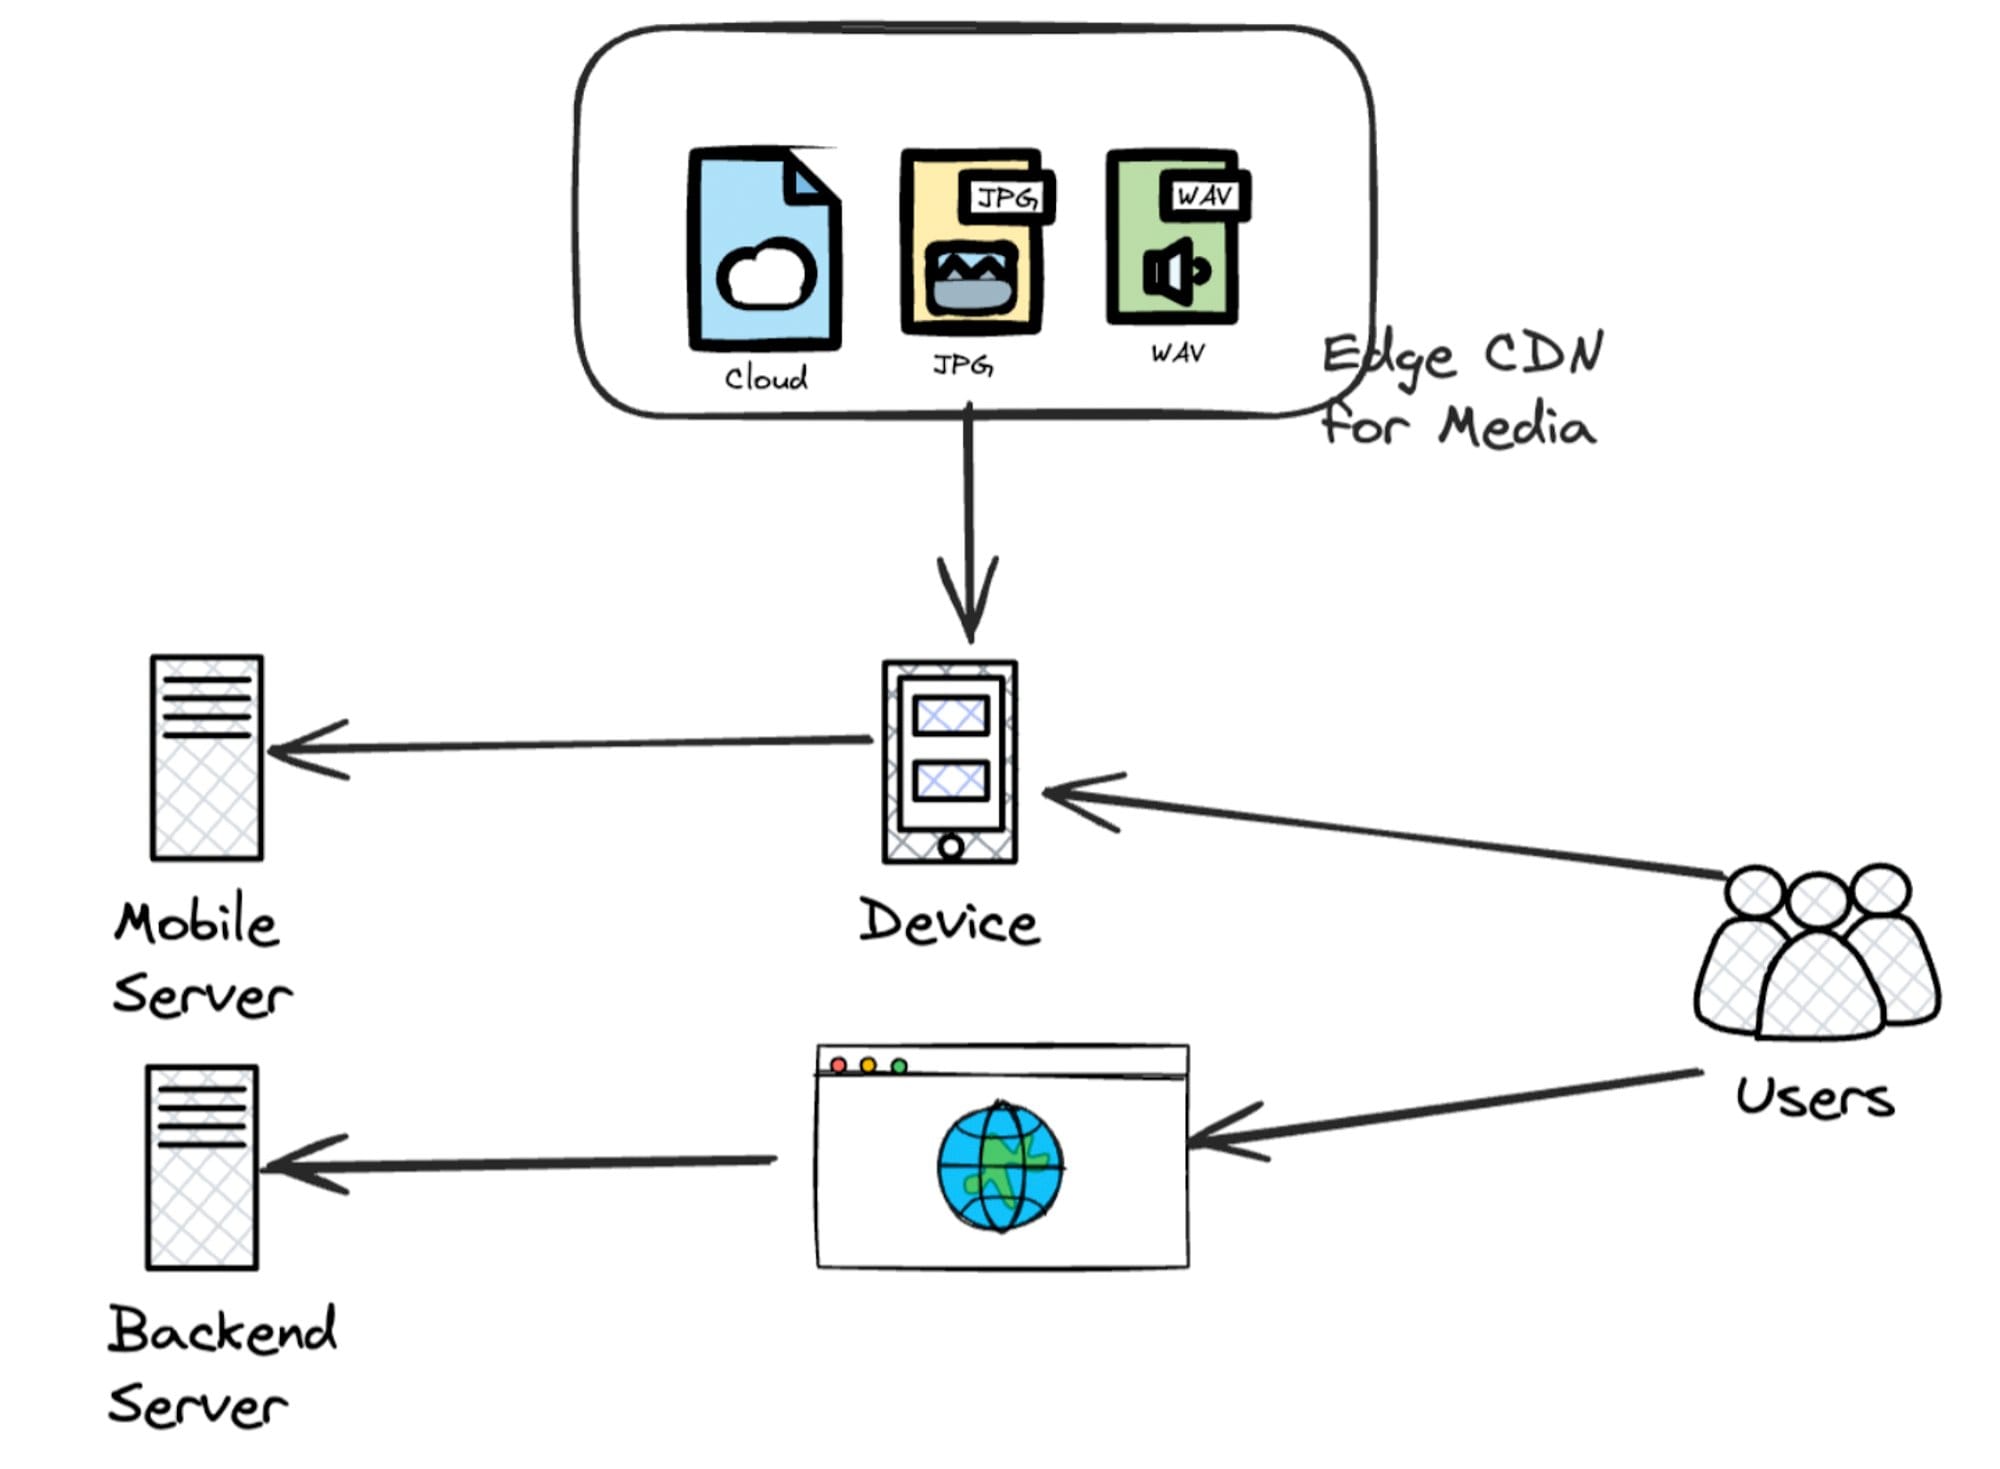
Social media, live streaming, and other over-the-top (OTT) platforms became widely popular. The user experience improved with faster performance. Notice the rapid shift in how complicated systems could get? Look at the image below 👇
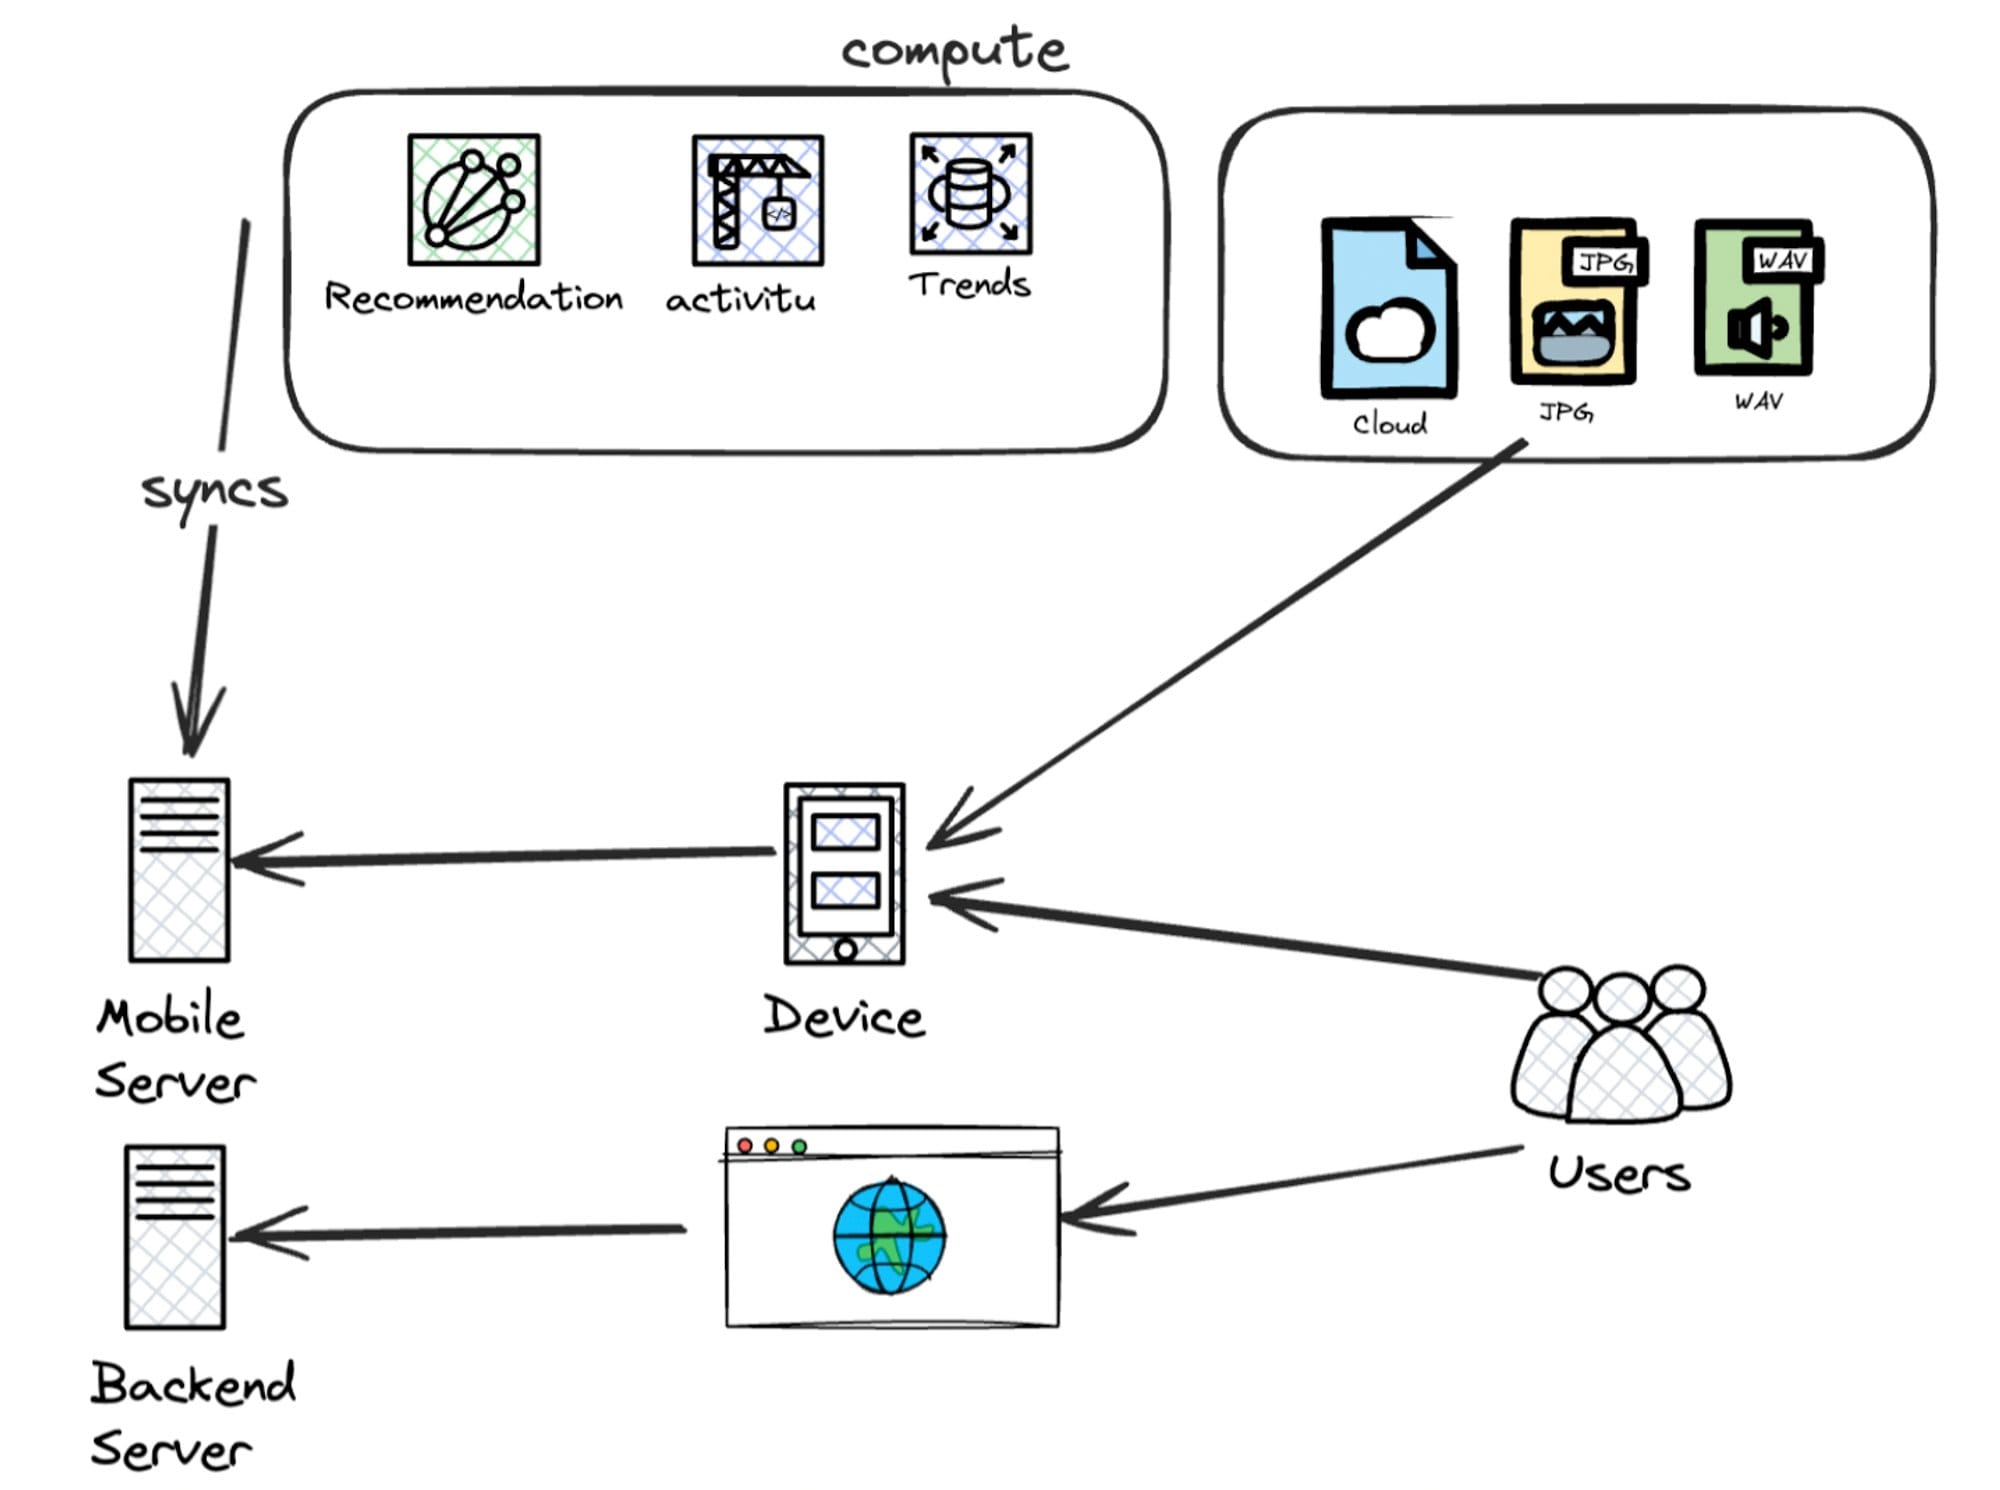
But as computing got closer to users, it became scattered, moving away from central systems. As systems spread out, ‘logic’ also spread out and can come from different sources.
Different groups of users can have different experiences based on:
- What they do
- How much they use the system, and
- How close they are to a server.
Now, engineers had to monitor two things:
- Customer experience
- Server Health
This shift happened so quickly that engineers couldn’t manage/understand the data deluge.
Monitoring is primarily handled by the Infrastructure on the server side. However, when requests reach the server, they may have lost the customer-specific information, or the cost of storing information needs to be lowered.
As a result, we had/have good coverage of Infrastructure health but little correlation to the Application and Product behavior.
This is unacceptable.
The incentive to solve these problems will only lock in an additional 1% gain.
Products cannot function with such a lack of transparency, so they create their own interpretation of system health based on events from the Endpoint devices. Suddenly, each team has its own monitoring and understanding of a system's health. Chaos!!
The problem with such fragmented opinions and views is that the Engineering teams rarely align to ‘Reliable customer experience’. They have a way of knowing that 99% of the requests are working, but they cannot extrapolate that to say that 99% of users are happy or not.
What a nightmare looks like: While Product can tell that 1% of users are abandoning a live stream, they cannot know whether it’s because of that 1 % experienced latency in their stream. It’s all fugazi !!!
The tooling available today requires kidneys and effort to answer the above question. The incentive to solve these problems will only lock in an additional 1% gain.
Thatʼs the thing about 9s, the cost and effort of jumping from 99 → 99.9% is the same as it takes from 90 → 99%.
While only a tiny portion of the customer experience is delivered through the backend, the entire telemetry data and lifecycle exist on the server side. This includes instrumentation libraries and OpenTelemetry specifications.
To bring Observability to answer questions about End-User Experience, we need technology to analyze data across different segments, such as regions, groups, and individual users. However, the current tooling cannot handle this level of Cardinality.
The technology available does not provide cost-effective ways of analyzing trends across different segments, like comparing last year's Black Friday sales to this year's.
With tools that improve the cost-effectiveness of bringing monitoring closer to the customer, it will always be cohesive and connected. Ok, so how do we fix this? What do you think should change?
I’ve dedicated a good 10 years to solving this across companies like Gojek and consulted with 5 unicorn startups and a dozen others.
I started Last9 because the tooling and approach for modern monitoring systems are fragmented at best and severely broken in reality. We have been working on solving this for about 3 years now, and something’s been cooking.
Coming soon… Levitate Streams.
If you want to understand how Levitate (Our managed Time Series DataWarehouse) differs from the rest, and how it can manage what we call “Cricket Scale”, please feel free to DM me. You can also schedule a demo.
Contents
Newsletter
Stay updated on the latest from Last9.
Handcrafted Related Posts

What is High Cardinality
Overview of what is high cardinality in the context of monitoring using Prometheus and Grafana
Prathamesh Sonpatki
Launching Alert Studio
Modern monitoring systems depend heavily on ‘Alerting’ to reduce the Mean Time to Detect (MTTD) faulty systems. But, alerting hasn’t evolved to meet the demands of modern architectures. We’re changing that with Alert Studio.
Aditya Godbole
Kubernetes Monitoring with Prometheus and Grafana
A guide to help you implement Prometheus and Grafana in your Kubernetes cluster
Last9