Jul 10th, ‘23/10 min read
Prometheus vs. VictoriaMetrics (VM)
Comparing Prometheus vs. VictoriaMetrics (VM) - Scalability, Performance, Integrations
There are a lot of time series databases, such as Prometheus, M3DB, TimescaleDB, OpenTSDB, InfluxDB, and so on. Prometheus and VictoriaMetrics are open-source time-series databases that provide robust solutions for monitoring and alerting in complex IT environments. However, they are designed differently and offer unique features that can affect their performance, scalability, and ease of use for monitoring workloads. This article aims to analyze the differences between Prometheus and VictoriaMetrics, thus providing insight for users seeking the most suitable solution for their specific needs as a monitoring solution and observability or troubleshooting their systems.
Prometheus
Prometheus, which began as a project within SoundCloud, is a powerful monitoring and alerting toolkit built specifically for dealing with time-series data in a multi-dimensional environment. It has grown immensely popular within the SRE and DevOps community due to its native support for multidimensional data collection, querying, and alert generation.
Prometheus is developed under the Cloud Native Computing Foundation (CNCF). The Prometheus server, client libraries, Alertmanager, and other related components can be found at the Prometheus GitHub organization. The main repository is: https://github.com/prometheus/prometheus
Know more about What is Prometheus?
VictoriaMetrics
VictoriaMetrics, on the other hand, is a high-performance, cost-effective, and scalable time-series database that can be used as long-term remote storage for Prometheus. It boasts superior data compression and high-speed data ingestion, making it an appealing alternative for large-scale monitoring tasks. VictoriaMetrics source code can be found at: https://github.com/VictoriaMetrics/VictoriaMetrics
The GitHub repositories for these projects contain all the source code, docs, issues, pull requests, and documentation. These are great resources and tutorials to get started using Docker if you want to understand more about how these systems work, if you want to contribute to the projects, or if you need help troubleshooting an issue.
Comparing Performance
The data ingestion and querying rates performance between VictoriaMetrics vs. Prometheus are based on a benchmark test using node_exporter metrics. The memory and disk space usage figures are for a single Prometheus or VictoriaMetrics server.
| Comparison | Prometheus | VictoriaMetrics |
|---|---|---|
| Data Collection | Pull based | Pull and Push based |
| Data ingestion | Up to 240,000 samples per second | Up to 360,000 samples per second |
| Data querying | Up to 80,000 queries per second | Up to 100,000 queries per second |
| Memory usage | Up to 14GB of RAM | Up to 4.3GB of RAM |
| Data compression | Uses LZF compression | Uses Snappy compression |
| Disk write frequency | Writes data to disk more often | Writes data to disk less often |
| Disk space usage | Requires more disk space | Requires less disk space |
| Query language | PromQL | MetricsQL (backward-compatible with PromQL) |
Comparing Scalability and Integrations
Architecture and Scalability
Prometheus uses a pull-based model for gathering metrics, meaning it fetches metrics from the monitored systems and can handle up to millions of active time series. This architecture simplifies the deployment of monitored services. Still, managing large, dynamic environments can be challenging as it requires Prometheus instances to know the targets it needs to pull from.
VictoriaMetrics, conversely, supports both pull and push models. Its ability to handle high volumes of data and more extensive networking scenarios (thanks to its push model support) makes it scalable and flexible. It clusters natively, which simplifies long-term storage and large-scale deployments.
Prometheus and VictoriaMetrics are built with a component-based architecture, enabling flexible deployments and allowing each component to be independently developed, tested, and deployed.
Prometheus Architecture
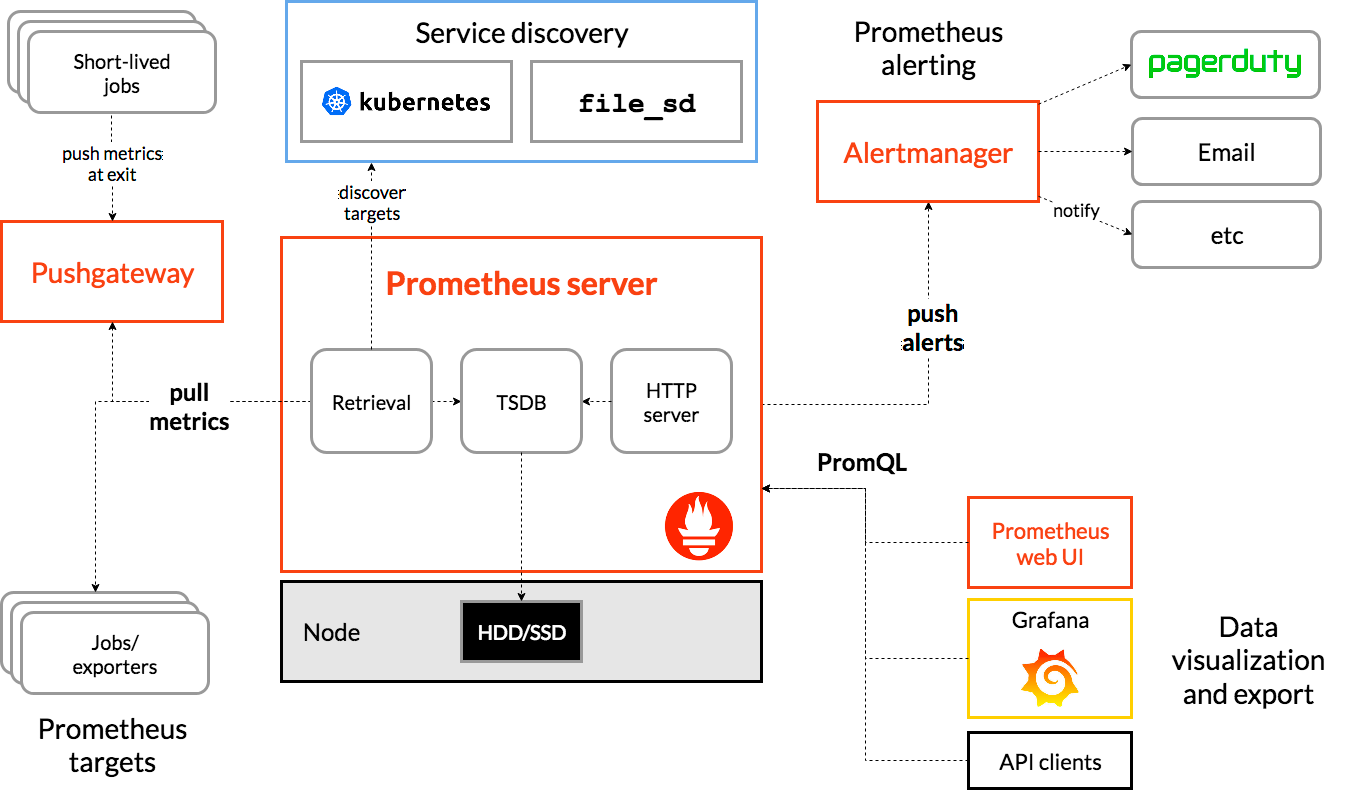
Prometheus is built with a pluggable architecture that consists of several key components, which include:
- Prometheus Server: The heart of the system, the Prometheus server is responsible for scraping and storing time series data.
- Client Libraries: These libraries provide metrics from applications code. Prometheus provides client libraries for several languages, including Go, Java, Python, and more.
- Exporters: These HTTP services expose metrics in a format Prometheus can ingest. Exporters are available for third-party systems such as HAProxy, MySQL or systems like Linux system statistics.
- Pushgateway: For services that cannot be scraped (e.g., short-lived jobs), Prometheus provides the Pushgateway. It allows ephemeral and batch jobs to expose their metrics to Prometheus.
- Alertmanager: This component manages alerts, de-duplicates, and groups and sends notifications via email, PagerDuty, or OpsGenie. It also takes care of silencing and inhibition of alerts.
- PromQL: This is Prometheus's built-in flexible query language for data exploration and dashboarding, different from SQL.
- Service Discovery: Prometheus supports various service discovery mechanisms that help it find the targets it should scrape.
VictoriaMetrics Architecture
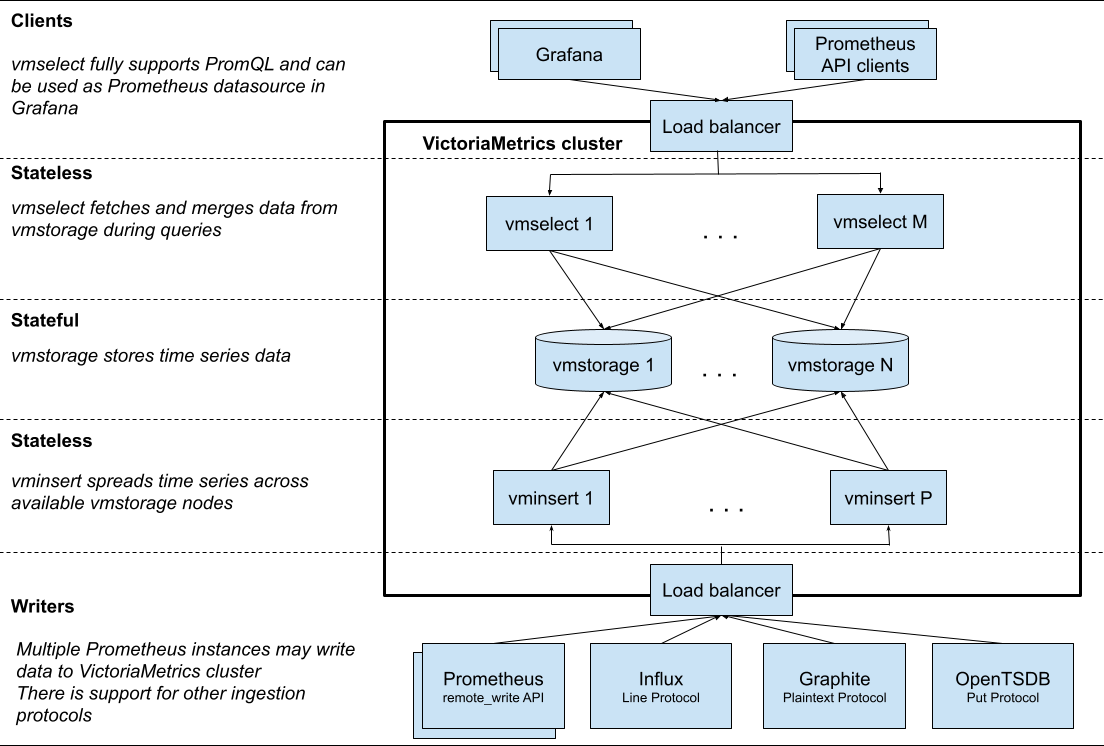
VictoriaMetrics, while maintaining a simpler architecture, also includes several core components:
- VictoriaMetrics Single-Node: This is the basic building block of VictoriaMetrics. It includes the time-series database and the HTTP server for ingesting and querying data.
- VictoriaMetrics Cluster: Designed for large-scale deployments, the cluster version of VictoriaMetrics includes additional components such as the VMSelect, VMInsert, and VMStorage nodes for query execution, data ingestion, and long-term storage, respectively.
- vmagent: Vmagent is a tiny yet powerful data scraper that can pull data from various sources and send it to VictoriaMetrics or any other remote storage that supports the InfluxDB or Prometheus remote write protocol.
- vmalert: It evaluates alerting and recording rules against VictoriaMetrics or any other compatible TSDB.
- vmctl: This CLI tool migrates data from different TSDBs to VictoriaMetrics.
- vmstorage: The Storage backend for VictoriaMetrics.
- vmui: The UI layer that comes out of the box with VictoriaMetrics.
Data Compression and Storage Efficiency
Prometheus also has an efficient storage system that doesn't match VictoriaMetrics regarding long-term data storage backends and retrieval efficiency. There are other alternatives, such as Levitate, Thanos and Cortex, which also provide long-term retention of data.
One of VictoriaMetrics' primary advantages over Prometheus is its data compression capabilities. It uses a more effective data compression algorithm that significantly reduces storage requirements. VictoriaMetrics claims to provide up to 10 times more data compression than Prometheus, a critical advantage for long-term data retention and cost optimization.
Both Prometheus and VictoriaMetrics use a combination of in-memory data handling and disk storage to manage time-series data:
Prometheus
1. In-Memory: Prometheus utilizes in-memory storage to access recent time-series data immediately. This segment of the database is known as the "head block."
2. Disk Storage: After reaching a certain age or size, data in the head block is moved to disk in a procedure known as checkpointingreal-time. This database consists of "persistent blocks" intended for longer-term storage.
Prometheus is optimized for real-time monitoring with this memory and disk storage combination. However, it isn't designed for extensive long-term storage. Additional tools like Levitate, Thanos or Cortex are usually incorporated into the system.
VictoriaMetrics:
1. In-Memory: Similar to Prometheus, VictoriaMetrics uses in-memory storage to buffer incoming data before it's written to disk. This approach helps optimize write performance. It also caches frequently accessed data for faster retrieval.
2. Disk Storage: The bulk of the data in VictoriaMetrics is stored on disk. The system uses a space-efficient storage format that allows for significant data compression.
Query Language
Prometheus uses PromQL (Prometheus Query Language). PromQL allows for selecting and aggregating time series data in real-time. It enables developers to work with metrics with high flexibility. Through PromQL, users can filter and aggregate metrics, calculate rates, ratios, averages, and percentiles, and predict trends. Once mastered, it's a very expressive language that allows users to perform complex queries to gather meaningful data from their metrics.
Levitate is fully compatible with open standards such as OpenMetrics, PromQL and OpenTelemetry.
VictoriaMetrics, on the other hand, is backward compatible with PromQL. It can run any query that is valid in PromQL. However, it also introduces an extension of PromQL called MetricsQL. MetricsQL is designed to enhance the query capabilities provided by PromQL. It introduces new functions, operators, and syntactic sugar. It simplifies and improves the user experience, especially for complex queries and aggregations.
Here are the primary differences between the two:
PromQL
- Developed by the Prometheus project, PromQL is known for its expressiveness, enabling users to filter and aggregate multidimensional time series data.
- PromQL supports various functions and operators, allowing users to calculate rates, ratios, averages, and quantiles and make predictions on their time-series data.
- However, PromQL can be complex to learn and use, especially for complicated queries, and its syntax can be cumbersome for some users.
MetricsQL
- MetricsQL is an extension of PromQL developed by VictoriaMetrics, designed to enhance querying capabilities and provide a more user-friendly approach to handling time-series data.
- It is fully compatible with PromQL, so any query valid in PromQL is also valid in MetricsSQL.
- MetricsQL introduces new functions, improvements, and syntactic sugar to simplify the query process. For example, it provides ways to work with multiple range vectors, work with string values, and aggregate data.
- While it retains the power and expressiveness of PromQL, MetricsQL strives to make complex queries easier to write and understand.
Ingestion Rate
Some differences in their design can affect the ingestion rate:
Prometheus:
- Prometheus is designed to pull metrics from monitored targets at regular intervals. The frequency of these scrapes can be adjusted to control the ingestion rate.
- The actual rate at which Prometheus can ingest data can depend on many factors, including the performance of the hardware it's running on, the complexity of the metrics being scraped, and the efficiency of the storage layer.
- If Prometheus cannot keep up with the volume of incoming data, it can drop samples or experience increased latency.
VictoriaMetrics:
- VictoriaMetrics has been designed to be more resource-efficient than Prometheus. It claims to ingest data more efficiently, with less CPU usage, RAM, and disk space for the same volume of data.
- This efficiency can enable VictoriaMetrics to ingest data faster than Prometheus on the same hardware.
- Regarding design, VictoriaMetrics can ingest data through pull (like Prometheus) and push models. The push model is beneficial for high cardinality data and ingestion rates.
High Availability and Reliability
Prometheus does not inherently support clustering, which means it does not provide native high availability. High availability can be achieved by running duplicate instances, but this process requires manual effort and coordination.
In contrast, VictoriaMetrics was designed with high availability in mind. It uses replication and clustering to ensure data is not lost in case of an instance failure, making it a more reliable option for critical applications.
API
Prometheus and VictoriaMetrics expose their functionalities through HTTP-based APIs, allowing clients to interact with them programmatically.
Prometheus API
Prometheus uses its HTTP API for a variety of tasks, including but not limited to:
- Querying: Prometheus provides the PromQL querying language, which users can use to extract metric data via the HTTP API. This makes it easy to integrate Prometheus with other services or scripts and consume the time series data in JSON format.
- Metadata: The API endpoint provides access to metadata about the series and labels in the Prometheus server.
- Administration: Certain administrative tasks, such as deleting series, snapshots, etc., can also be performed through the API.
VictoriaMetrics API
VictoriaMetrics provides a comprehensive HTTP API that is divided into several parts based on the functionality:
- Metrics API for Prometheus: This API is compatible with Prometheus's HTTP API, meaning you can use VictoriaMetrics as a drop-in replacement for Prometheus. This includes APIs for reading and writing metrics data.
- InfluxDB API: VictoriaMetrics also provides an API compatible with InfluxDB's write and query APIs. This makes it easy to switch from InfluxDB to VictoriaMetrics.
- Graphite API: VictoriaMetrics also provides a compatibility layer for Graphite's API.
- MetricsQL and PromQL APIs: These are used for querying metrics data stored in VictoriaMetrics. MetricsQL is a VictoriaMetrics-specific extension of PromQL and provides additional functionality unavailable in PromQL.
- Miscellaneous APIs: VictoriaMetrics also provides several other APIs, for example, to export data, get internal metrics, delete metrics data, etc.

Integration with Grafana
Visualizing data in Grafana for both Prometheus and VictoriaMetrics is quite similar, thanks to Grafana's flexible data source support. Here's an essential guide on how to visualize data from both of these systems:
For Prometheus:
1. Install and run Grafana: You can download Grafana from the official website. Once installed, you can access the Grafana UI through your web browser.
2. Add Prometheus as a data source:
- From the Grafana home screen, select "Configuration" (the gear icon) from the side menu.
- Select "Data Sources" > "Add data source".
- Select "Prometheus" from the list of options.
- In the HTTP section, set the 'URL' to the address of your Prometheus server (like
http://localhost:9090). - Click "Save & Test" to verify the connection.
3. Create a dashboard:
- Go to the Grafana homepage and select "Create" > "Dashboard" from the side menu.
- Click on "Add Query". You can enter your PromQL queries from the query editor and visualize the results.
For VictoriaMetrics:
The process is quite similar, with a few slight differences.
1. Install and run Grafana As above.
2. Add VictoriaMetrics as a data source:
- From the Grafana home screen, select "Configuration" (the gear icon) from the side menu.
- Select "Data Sources" > "Add data source".
- Select "Prometheus" from the list of options.
- In the HTTP section, set the 'URL' to the address of your VictoriaMetrics server (like
http://localhost:8428). - Click "Save & Test" to verify the connection.
3. Create a dashboard:
- Go to the Grafana homepage and select "Create" > "Dashboard" from the side menu.
- Click "Add Query" to enter your MetricsQL or PromQL queries from the query editor and visualize the results.
Grafana supports various visualizations like graphs, tables, heatmaps, and single stats. Once you've set up your data source and connected to Prometheus or VictoriaMetrics, you can create and customize these visualizations to fit your needs.
Integration with Kubernetes
Prometheus and VictoriaMetrics can monitor Kubernetes (K8s) clusters and deploy within a Kubernetes environment in cloud providers such as AWS and GCP.
Prometheus
Prometheus, a part of the Cloud Native Computing Foundation (CNCF), just like Kubernetes, has robust support for monitoring Kubernetes environments.
1. Monitoring: Prometheus natively supports Kubernetes service discovery, meaning it can automatically discover and scrape metrics from your services, nodes, and pods.
2. Deployment: Prometheus can be deployed on Kubernetes using the stable Prometheus Helm chart or the Prometheus Operator. The Prometheus Operator simplifies the deployment and configs of Prometheus, Alertmanager, and related monitoring components. It also provides Kubernetes custom resources to deploy and manage Prometheus and Alertmanager instances.
VictoriaMetrics
VictoriaMetrics also offers extensive support for Kubernetes monitoring and deployment.
1. Monitoring: VictoriaMetrics can scrape Prometheus metrics and use the same service discovery configs as Prometheus to discover and scrape Kubernetes services. There's also vmagent, a VictoriaMetrics component designed to fetch Prometheus metrics from various data sources, including Kubernetes.
2. Deployment: VictoriaMetrics can be deployed in Kubernetes using its Helm charts.
Conclusion
In conclusion, using Prometheus or VictoriaMetrics will depend on your specific needs. With its powerful querying capabilities and tight integration with other CNCF projects, Prometheus might be more suitable for environments where these features are valued. On the other hand, if scalability, data compression, and high availability are your main concerns, VictoriaMetrics could be the better choice. It's always recommended to carefully assess your monitoring needs and constraints before settling on a solution.
Compare different time series databases at one place and understand their differences.
Contents
Newsletter
Stay updated on the latest from Last9.
Handcrafted Related Posts
Rethinking Anomaly Detection: Focus on business outcomes
From the trenches at Games24x7 — Sanjay, on how Reliability engineering should drive core business metrics
Sanjay Singh
Prometheus vs Datadog
Comparison between Prometheus and Datadog - two of the most popular monitoring tools in the market today
Last9
OpenTelemetry vs. Prometheus
OpenTelemetry vs. Prometheus - Difference in architecture, and metrics
Last9