Amazon found that every 100ms of Latency, cost them 1% in Sales*
*A 2017 Akamai study shows that every 100-millisecond delay in website load time can hurt conversion rates by 7%
Modern SaaS companies build and ship software that captures or touches customers in crucial moments of their lives, like ordering food in a moment of joy, posting a picture in a moment of endearment, or posting a tweet in a moment of thought. This demands and warrants the service to be available at that moment, and SaaS companies deploy complex software to keep their services up and running 24x7. Deploying well-tethered distributed systems or microservices is now a norm.
These distributed systems are touched and managed across teams many times a day. They are made of multiple layers, sometimes dedicated to a service or sometimes shared as an internal Platform. Example: A team may use its Database, which is managed and provisioned by an Infrastructure team, but might also use the common Kafka bus for asynchronous exchange; they could also serve on a standard firewall and gateway being managed by a separate unit. The lines of responsibility and authority are usually coarse rather than refined. Another unique aspect of these systems is that these system architectures typically fail due to interaction between multiple systems, far more than the component faults alone.
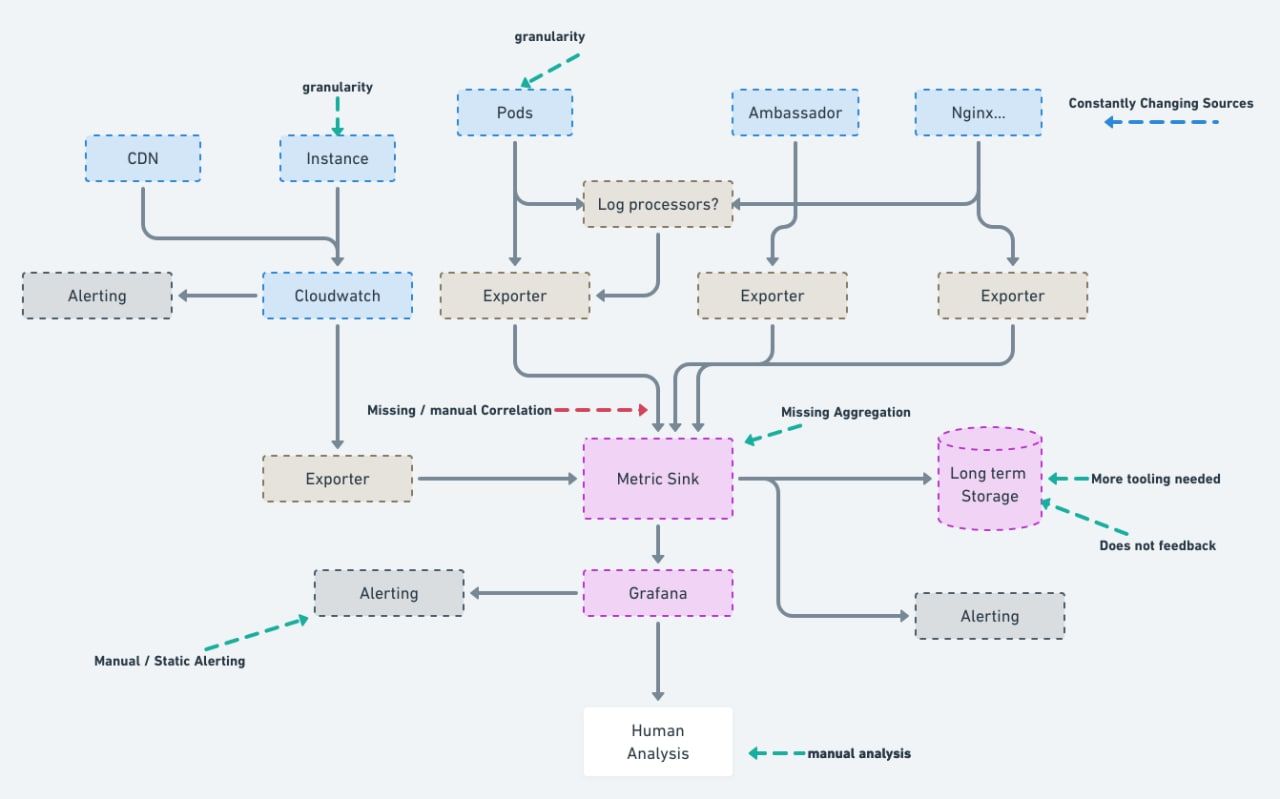
In an extensive complex system, every team deploys their Infrastructure monitoring technologies to ensure the uptime of their components. Infrastructure Monitoring, as commonly implemented, relies on building dashboards and threshold-based alerting to escalate problems when they occur. There is a fundamental limitation to this approach, i.e., very rarely will an existing dashboard catch unknown issues. So every new situation, which most likely was unknown previously, will not be caught as an alarm.
The industrial term for this problem is Watermelon Metrics; A situation where individual dashboards look green, but the overall performance is broken and red inside. Unlike a watermelon that you can dissect to find the Red, examining metrics isn’t easy because software engineers may not have collected metrics to the appropriate level of richness.
It leads to the paradox of foreplanning into what precise dissection may be needed at a later point in time.
While this problem may seem novel for software systems, it is a well-known problem for other engineering domains. The engineering industry has spent a lot of time and money researching principles and practices that engineers must follow for smooth and reliable assembly lines and machinery operations. One such technique is Observability, a measure of how well one can infer the internal states purely based on its output by looking at the system as a whole and not just the individual components.
Each team views an architecture from its perspective and has its own set of questions. The ability to answer these questions without a code-change for each specific question makes a system Observable. The source of truth for these answers is not restricted to just one, but a combination of Logs, Metrics, traces, policies, changelogs, deployments, and many more.
Here are everyday questions that generally take a war-room effort to get the answers.
- What other services are impacted?
- What is going wrong?
- Is this happening somewhere else?
- Did we deploy something?
- Is the <external API> impacting us?
- It’s Kafka. Right?
- What’s the reason for this increased error rate?
- Did we get a page?
- Something is wrong. We had a massive spike of alerts
The core problem is being able to answer these questions as fast as possible.
Observability is not just about being able to ask questions to your systems. Its also about getting those answers in minutes and not hours.
How do we go about doing this?
- Ingest all varieties of observability pillars, be it logs, metrics, or traces.
- Go above and beyond the manual analysis using dashboards and cross-hairs to detect correlations between normal and abnormal automatically.
- Break the need for static thresholding that needs to be looked at constantly, instead build correlations and reliably inform the stakeholders with the correct contextual information ONLY.
Take a look at these (real) scenarios and imagine how many layers of infrastructure monitoring tools would be needed to alert on these:
- An Ingress rule of a security group was altered that shuts all traffic reaching the public-facing Load Balancers. Application metrics continue to look green.
- A rise in backend errors sends out at least three alerts; One for the backend, One for the proxy; and one for each dependent service, which in turn may start failing too.
- The context is primarily inferior. It takes a while to figure out what services are under threat and if it’s going to break an SLO or not.
- The alert fatigue is real and requires 3x expenditure in human resources.
- An extremely marginal percentage (0.05%) of requests are erroring with degraded latency on a Saturday at 5 PM. While this may look normal to the naked eye, at least one of the following may also be true
- It’s unusual for a Saturday at 5 PM to have this error rate.
- With no increase in Daily Active Users or Concurrent users, the spike seems unreasonable.
- Even a 0.05% error ratio may defeat the SLO within the next 14 minutes because a similar outage had happened on Thursday, leaving the service is left with a minimal error budget for the week.
The questions mentioned above only scratch the surface of problems, yet they require many tools and people to find the answers.
There is an additional burden that SREs (Site Reliability Engineers) need much specific knowledge and simply cannot be trained via a curriculum to have on-call maturity.
A typical monitoring landscape

Last9 plugs into existing data sources like Cloud Audit Trails, logs, and metrics of standard components, deployment, and change events. With next to no code changes, Last9 builds a temporal knowledge graph that tracks resources and relationships, allowing its users to deal with Services and not servers.
All of this data is classified per service and passed through change intelligence and correlation engines to automate and speed up the tedious process of finding cascading anomalies and root causes. To learn more about how we do this, we have a detailed technical whitepaper about our solution.
It is well established that when operational data is utilized the right way, it can massively improve.
- Customer experience, retention
- Developer productivity
- Operational costs
In times like these, when the average attention span of online users is now comparable to that of a Goldfish, the Reliability of operations can be a massive differentiating feature of your business!


