Introduction
When discussing monitoring through metrics, two extremes come to mind:
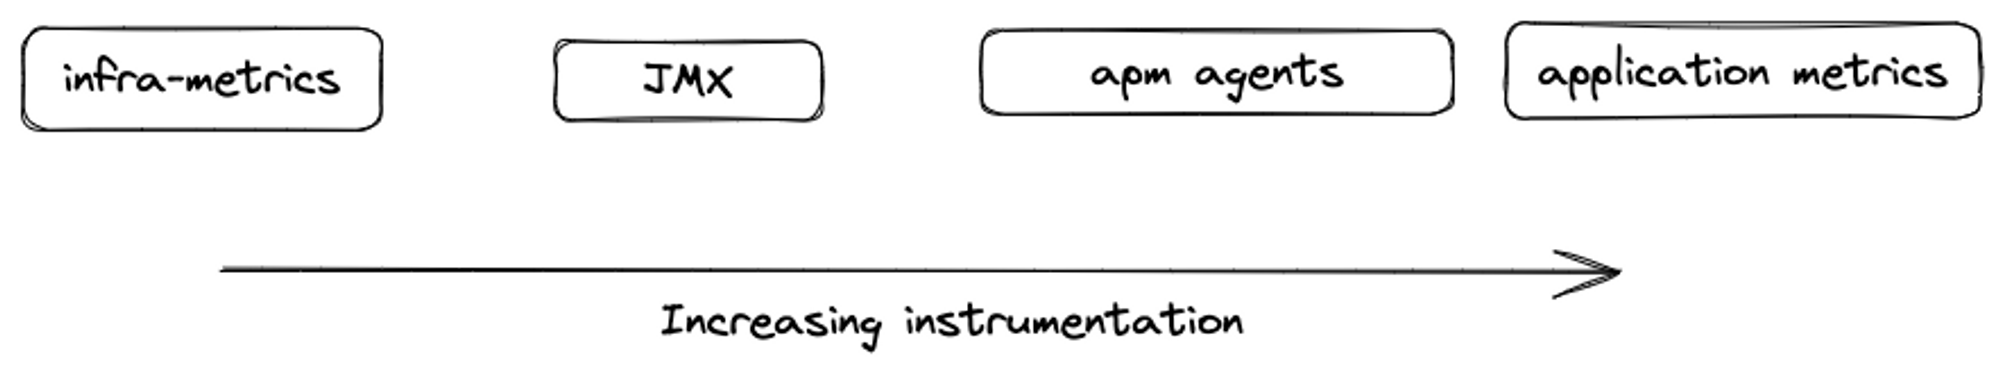
- Metrics that are easily available with minimal efforts, such as infrastructure metrics for load balancers, databases, Kubernetes, etc. Simply flip a switch in your cloud provider and start receiving the data.
- Metrics that require changes to the application code to emit business metrics through libraries, such as instrumentation using Micrometer or OpenTelemetry.
Enabling infra metrics is easy and provides sufficient data to get started. Instrumenting business metrics provides valuable insights, although it requires buy-in from multiple teams. Development and Product teams also need to agree on metrics to emit with a common framework. This option also has maintenance overheads, as every line of code counts, especially when building a calculator.
Drop-in agents are libraries you include in your code to monitor your application's performance. They're somewhere between the two extremes we talked about before. They usually belong to a specific vendor, like NewRelic or Datadog, and often fall under the category of Application Performance Management (APM). Recent projects, such as OpenTelemetry, are doing a great job of ensuring interoperability between open and commercial metric formats. This is helping democratize agent-based metric collection.
JMX
One example of a lightweight agent-like scenario that was ahead of its time is JMX (Java Management Extensions). JMX is a specification for monitoring Java applications. It offers the benefits of open source, ease of JVM monitoring without the overhead of changing any application code, and the flexibility to provide application-specific metrics, should you choose to instrument your code.
JMX was introduced in Java 1.5, which was released on September 30, 2004. At that time, today’s defacto monitoring solutions like Prometheus, OpenTelemetry did not exist, and the industry relied on tools like Nagios and Icinga for monitoring.
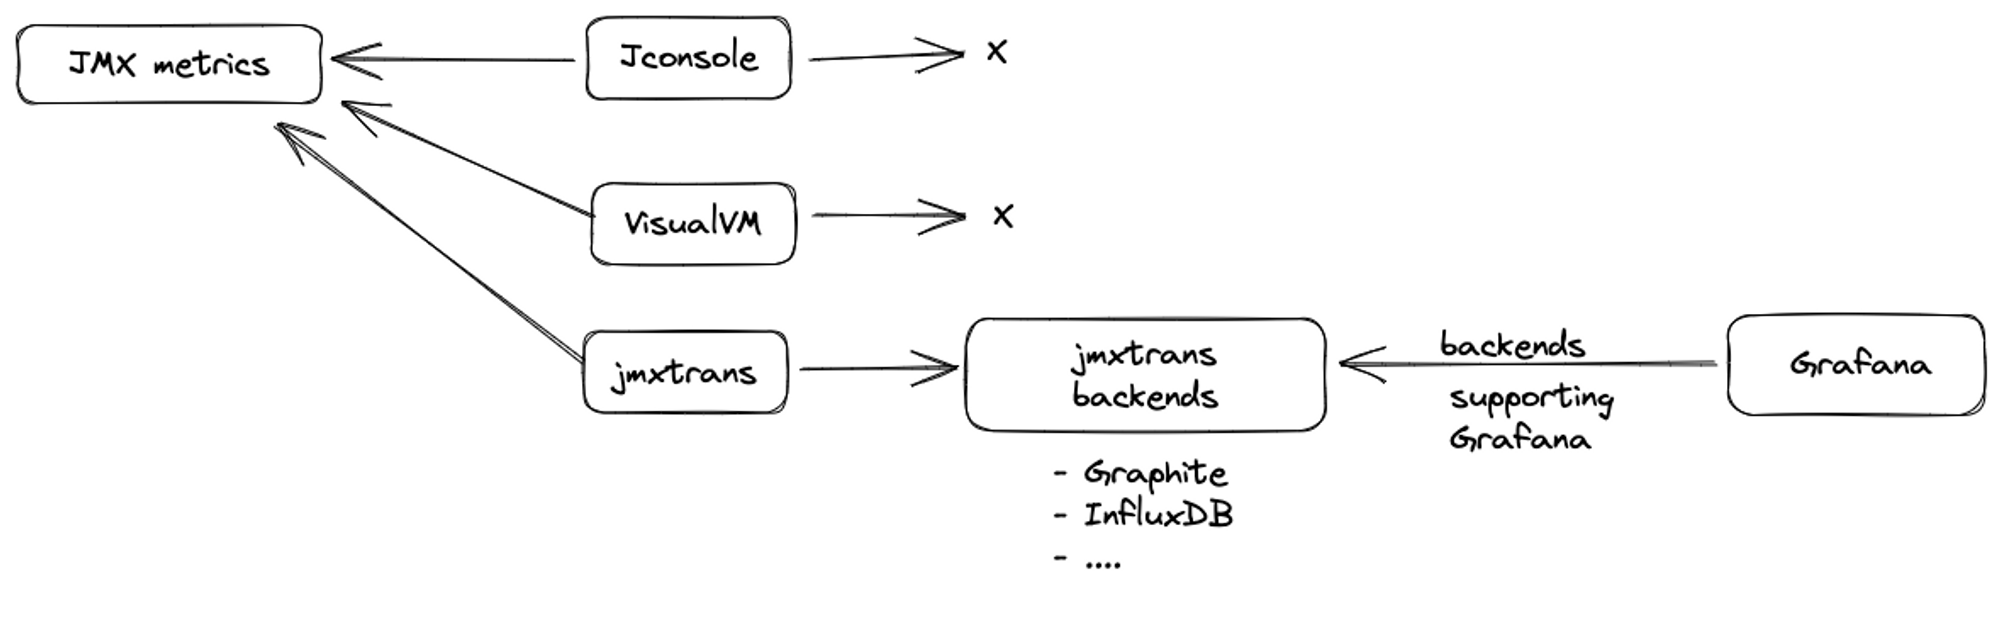
JMX provides the user with a Remote Management layer to build client-side tooling. The open-source community developed useful client-side visualization tools that connected to a specific port to obtain JVM metrics and provided a UI to visualize those metrics, such as JConsole and VisualVM.
Integrating with new-age TSDBs
But as time passed, the number of time series databases (TSDBs) grew. Graphite, Statsd, InfluxDB, Prometheus, and Victoriametrics joined the gang. With more time series databases came more metric shipping tools like collectd, statsd client, and Prometheus exporters.
In this new order, JMX visualization tools no longer fit in because they were an end in themselves - they collect, store, and visualize data. Grafana became the preferred dashboarding tool, and everyone wanted to dashboard everything. Seeing JMX metrics alongside infrastructure metrics was within reach. The jmxtrans project came in at the right time which shipped JMX metrics to multiple backends like Graphite and InfluxDB. Grafana can communicate with most of these backends.
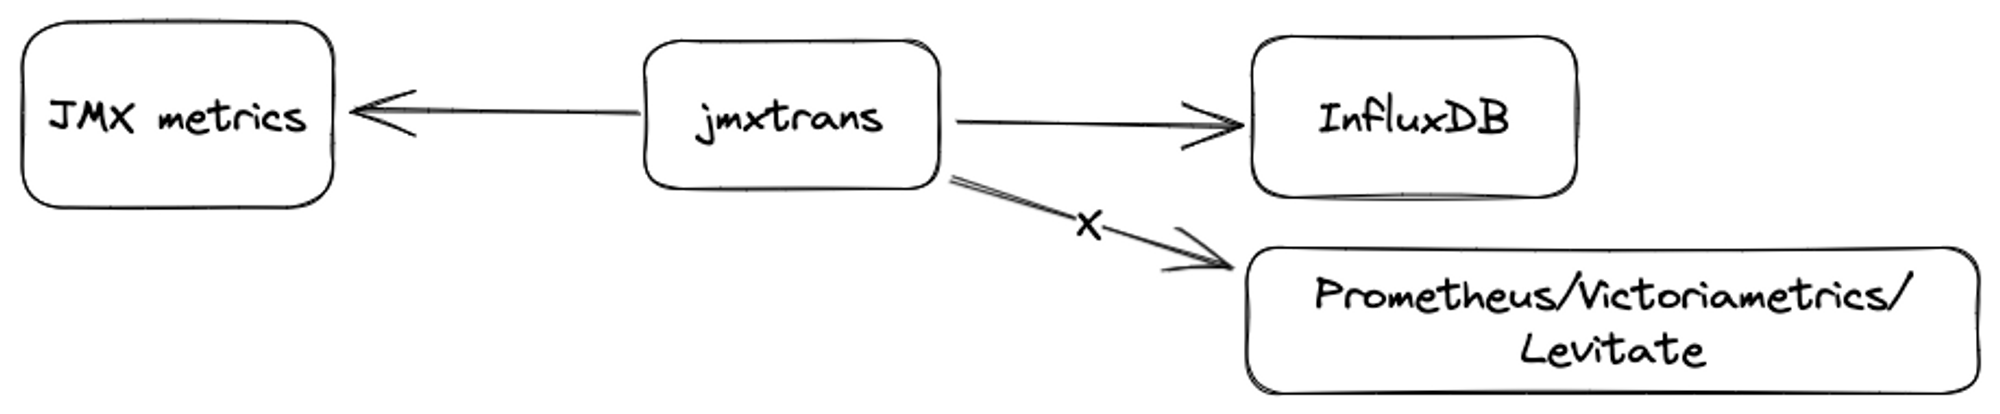
Unfortunately, jmxtrans does not support Prometheus as a backend, which led to a problem for us. One of our customers was using jmxtrans to send metrics to InfluxDB. However, most of their applications and infrastructure components were using Levitate, which is compatible with Prometheus and OpenMetrics in terms of accepting and querying metrics.
Levitate is a managed time series warehouse offered by Last9. All the learnings mentioned here apply equally to TSDBs like Prometheus and VictoriaMetrics.
Both Levitate and InfluxDB are great TSDBs but managing multiple TSDBs is an overhead because:
- Even if you use managed solutions, you need to speak the terminology of specific TSDBs on the client side e.g. InfluxDB has the concept of measurement, while Prometheus-like TSDBs don’t.
- Both InfluxQL and PromQL are rich querying languages. Developing expertise in both simultaneously is hard.
To simplify the process of both maintenance and query languages, our customer wanted to shift all metrics to Levitate.
However, to ensure that existing alerting and dashboards remain functional during the migration, we wanted a mechanism that could send metrics to both InfluxDB and Levitate. Prometheus JMX exporter didn’t fit the bill as it can communicate only with Prometheus + it had the customer overhead of running one more exporter in parallel with jmxtrans.
Default metric name limitation
After doing the hard work of googling "send jmxtrans metrics to prometheus", we figured that vmagent (VictoriaMetrics' favorite metric shipper) supports accepting metrics in Graphite format and pushing them to a Prometheus-compatible backend. jmxtrans supports sending JMX metrics in Graphite format using the -GraphiteWriterFactor

We built the above pipeline with a sample Java app here. Upon running it, we got the metric names in this format:
sample.service.jvmapp_4000.sun_management_MemoryImpl.HeapMemoryUsage_committedThis name comprises multiple tokens which are better served as labels:
service=sample.serviceinstance=jvmapp_400__name__=HeapMemoryUsage_committed
In the absence of these labels, it doesn’t make sense to use the flattened metric name containing all the information because you cannot create Grafana dashboards that rely on specific labels like service or instance.
vmagent remote write relabeling to the rescue
To solve this problem, vmagent came to the rescue with its https://docs.victoriametrics.com/vmagent.html#graphite-relabeling graphite relabeling features.
The following vmagent config...
- action: graphite
  match: "*.*.*.*.*"
  labels:
    __name__: "${5}"
    service: "${1}_${2}"
    instance: "${3}"
...converts...
"__name__" : "sample.service.jvmapp_4000.sun_management_MemoryImpl.HeapMemoryUsage_committed"...to...
"__name__": "HeapMemoryUsage_committed",
"instance": "jvmapp_4000",
"service": "sample_service"
This configuration worked well for applications that followed the metric naming convention used in the sample app. However, we wanted to shift Kafka metrics from InfluxDB to VictoriaMetrics. Kafka has multiple moving parts, such as brokers, topics, and consumers. Therefore, we applied our knowledge of relabeling and converted...
"__name__": "sample.service.kafka_1099.BrokerTopicMetrics.BytesInPerSec_topic1.OneMinuteRate"...to...
"__name__": "BytesInPerSec",
"category": "BrokerTopicMetrics",
"instance": "kafka_1099",
"service": "kafka_1099_BrokerTopicMetrics",
"topic": "topic1"
...via the following vmagent config.
- action: graphite
  match: "sample.service.*.*.*_*.*"
  labels:
    __name__: "${3}"
    topic: "${4}"
    instance: "${1}"
    category: "${2}"
The dot limitation
Graphite uses dots as separators. If a label field contains a dot, it is escaped by converting it to an underscore. For example, the following label:
"topic": "topic.1"becomes
"topic": "topic_1"From a customer perspective, this approach has the following disadvantages:
- Dashboard queries containing topic names with
.will need to be rewritten. - The same applies to alerts.
- Teams will need to be educated that using
.in topic names is no longer supported. This will prevent end users from creating two topics such asa.banda_band expecting them to be different. Although these topics will be different in Kafka, they will be treated as the same once they pass through the vmagents relabeling rules, which can cause confusion.
There weren't enough topics that had dots to justify spending time on solving this issue. Therefore, we decided to live with the aforementioned limitations. If the dot limitation was non-negotiable, we would have to either look for another output plugin of jmxtrans that respects dots but doesn't have any new limitations or consider switching to Prometheus JMX exporter.
That's about it! This exercise serves as a useful reminder that even in today's plug-and-play world, we often run into challenges while integrating modern solutions with dated metric pipelines.
Lessons learned
- If you treat the problem of getting jmxtrans to communicate with Prometheus as a standalone proof of concept and simply share a Google link with the customer, you may miss uncovering certain corner cases. Customer problems are real problems, and there is often much more going on beneath the surface.
- Learning from the history of software is valuable. As everything evolves, it's essential to look back and learn from the past.
- Sometimes the time cost of solving a problem outweighs the one-time inconveniences one can choose to live with. Be pragmatic and take a call. Not every problem needs to be solved.