

Latency is an indicator of how long it takes for a request to reach and return to the customer. Its measures in a unit of time and is a critical pillar in defining the Quality of a Service. As long as it is served within a specific time range, it's great. However, it's almost impossible to operate a latency within limits to all requests that come in, and NOT all requests are equal.
The most preferred unit of measurement is a percentile, and the health Indicator is a bi-variate expression of the form
95% of the requests must complete within 350ms.
SLO Breach
How do you report something is broken when 95% of the requests are not completed within 350ms? Simple. But what do you say?
- Only 90% of the requests are serving within 350ms and not 95%
- 95% of the requests are performed within 400ms now and not 350ms.
While both of the reporting is valuable, they both convey a different meaning.
Option 1: 90% of the requests are serving within 350ms and not 95%
It tells me that I was OK with 5% of the traffic/requests being degraded. But now that number has climbed up to 10%.
Option 2: 95% of the requests are served within 400ms now and not 350ms.
This number tells that 95% of requests have degraded further to 400ms instead of 350. But this does not tell me how much of the user base is served well. 94.99% of the users may still be OK. While the difference is only 0.01%, it may paint a picture of panic.
If you disagree with Option 1 being a better fitment or have Option 3 to suggest, please leave a comment.
SLO Threat
While this solves the argument of SLO, the question now remains of alerting. When should we be warned of a potential breach?
Requests usually look like this.
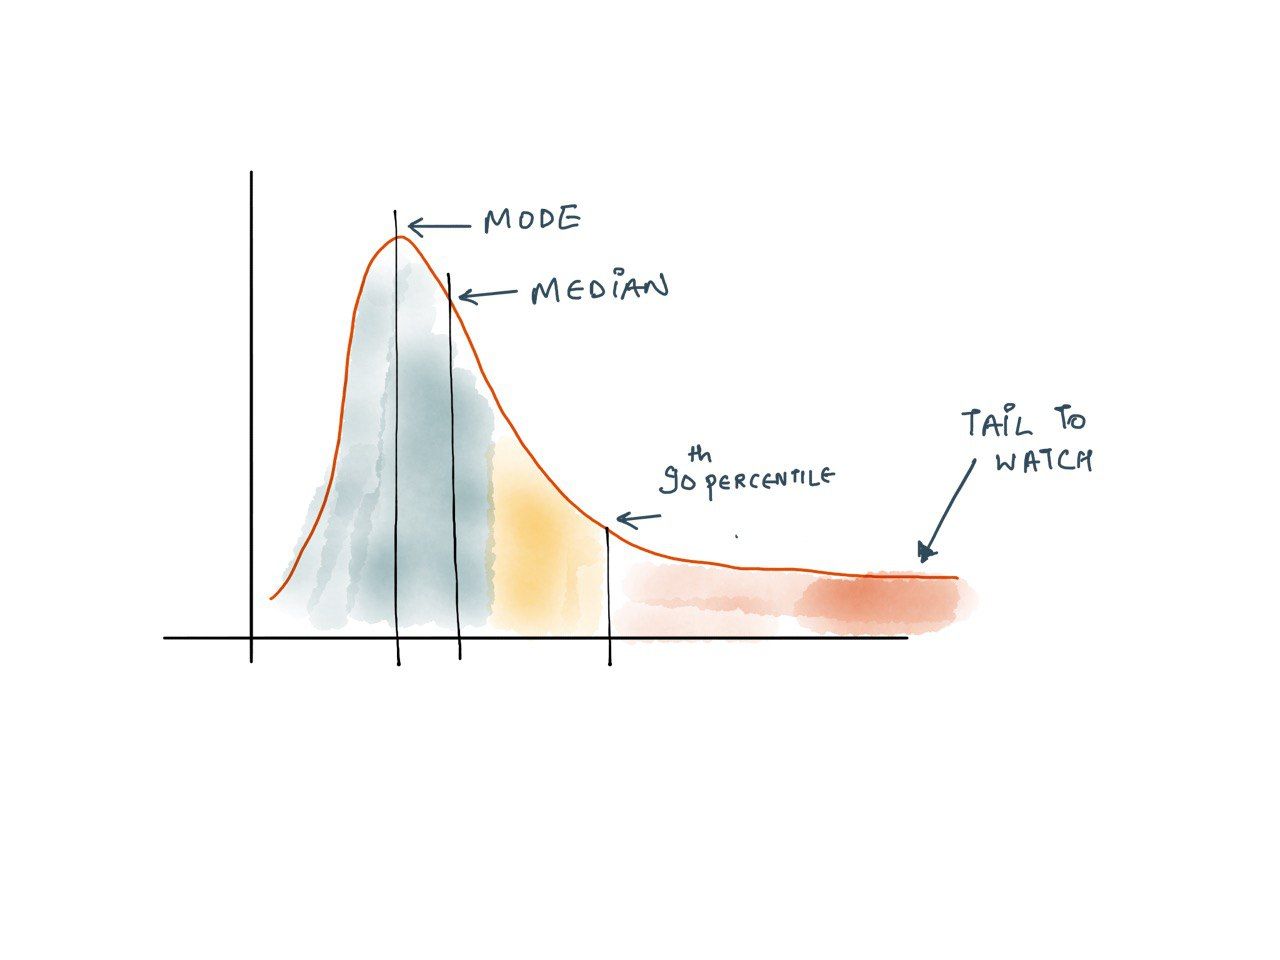
Even though a small fraction of requests experiences extreme latency drops, they should be alerted because it tends to affect your most profitable users. These users tend to be the ones that make the highest number of requests and thus have a higher chance of experiencing tail latency. In addition, several studies have proven that high latency affects revenues: A mere 100-millisecond delay in load time can hurt conversion rates by 7 percent.
Then there is also a cost-value tradeoff.
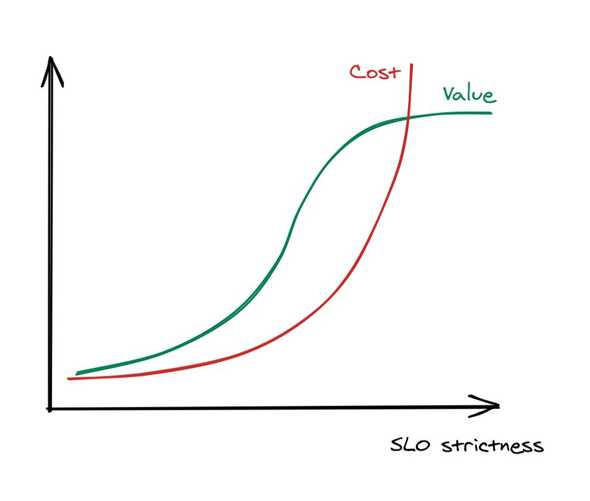
As the SLOs get stricter, the cost of enforcement surpasses the value that they bring.
A delicate balance is, setting an SLO to track 99% of the requests. And early warning on the performance of the far end of 99.5% and 99.9% of the requests. But what should be a tolerant value for those far-off requests? It should be computed based on a baseline based on earlier data. The easy way to catch degradation is to keep an eye on the shape of the tail. If,
- The tail gets thinner and stretches towards the right, OR
- The tail gets thicker, where the worst 100% is improving, but the ones between 99% and 99.9% concentrate, suggesting movement towards 99.9%. Simply put, the gap between
modeandmaxreduces.
Further reading: read more about Service Level Indicators setting and Service Level Objectives

