A simple guide to crunch numbers for understanding overall HTTP content length metrics.
Nginx is commonly used as an ingress proxy — your public load balancer receives a request and passes it on to Nginx, which in turn checks it against pre-set routing rules and passes it on to the right application. In my setup, the traffic pattern consisted of HTTP requests but I had to enable my public endpoint temporarily to receive Prometheus remote write metric traffic. As soon as I did that, I saw a flurry of these warning log lines in Nginx:
[warn] 97#97: *605464656 a client request body is buffered to a temporary file /var/cache/nginx/client_temp/0014975406, client: 1.2.3.4, server: xyz.com, request: "POST /endpointN/prometheus/write HTTP/1.1", host: "xyz.com"/endpointN corresponds to an internal metric source where N=1, 2, 3, etc.
A quick google search showed that this is because the content size of the POST request was greater than the in-memory buffer size set by Nginx. This means the file was being cached to /tmp.
This warning was also accompanied by a more serious error
413 Request Entity Too LargeThis is a known problem of POST body size > permissible limit and the solution is to increase client_max_body_size. How much should this size be — 32 MB, 64 MB? Setting it to 64 MB might have been good enough. I did that and the error went away.
However, rather than blindly setting it to 64 MB, I also wanted to know numbers like min, max, avg, P50 to understand typical values of content length during peak traffic hours.
Why? Because till we have a permanent solution for capturing these metrics, it helps to have a rough calculation handy to know what is the current normal.
There are multiple ways to do this, in increasing order of complexity and cost:
- Drink from the firehose of live traffic and dump
Content-LengthHTTP headers locally.
- Pros: quick, no extra setup, works directly with HTTP requests so no dependency on log format.
- Cons: Gives rough numbers, not a permanent solution, your number crunching script/cli is running on a prod system (avoid doing this — use a load test env if possible).
2. Ship Nginx logs to S3 via a log shipper like Fluentd for offline analysis.
- Pros: Long term offline storage, Minimal $, can query historical data.
- Cons: Log shipper installation.
3. Ship Nginx logs to a log analytics tool like ELK, Splunk, etc for realtime analysis.
- Pros: Log based alerting, faster adhoc search.
- Cons: Log shipper installation, more $$ and the headache of managing a managed service.
Each option has its place depending on how fast / permanent you want your results to be. In my case, I just wanted to know rough numbers till I implemented option-2 — so we will go with the option-1 — analyze live traffic locally.
An easy way to accomplish this is to take a tcpdump of the traffic during peak hours and do simple math on it.
tcpdump -A -vvv -nli any '(port 8080) and (length > 74)' -s 0 -w - 2>/dev/null | strings | grep -A10 HTTP | grep Content-Length > /tmp/content-lengths.txtThis dumps lines in the following format:
Content-Length: 222Content-Length: 124..Find max content length
cat /tmp/content-lengths.txt | cut -f2 -d':' | tr -d ' ' | sort -nr | head -1Find min content length
cat /tmp/content-lengths.txt | cut -f2 -d':' | tr -d ' ' | sort -n | head -1Find average content length
total_size=$(cat /tmp/content-lengths.txt | cut -f2 -d':' | tr -d ' ' | paste -sd+ | bc)total_lines=$(wc -l /tmp/content-lengths.txt | awk '{ print $1 }')echo "scale=2; $total_size / $total_lines" | bcFind P50
cat /tmp/content-lengths.txt | cut -f2 -d':' | tr -d ' ' | sort -n > /tmp/content-distribution.txttotal_lines=$(wc -l /tmp/content-lengths.txt | awk '{ print $1 }')target_percentile=50target_line=$(echo "$target_percentile * $total_lines / 100" | bc)sed -n ${target_line}p /tmp/content-distribution.txtThe above calculation assumes that number of lines captured > 100.
For getting P99 — replace target_percentile with the right number.
If this isn’t enough and you still crave for fancy graphs showing a list of percentiles, use /tmp/content-length-distribution.txt and power it up with termgraph and a simple shell script - saurabh-hirani/bin/percentile.sh which takes an input list of percentiles, calculates their values and feeds it to termgraph.
cat /tmp/content-length-distribution.txt | ./percentile.sh $(seq 1 10 | while read p; do echo "$p * 10" | bc; done) | termgraph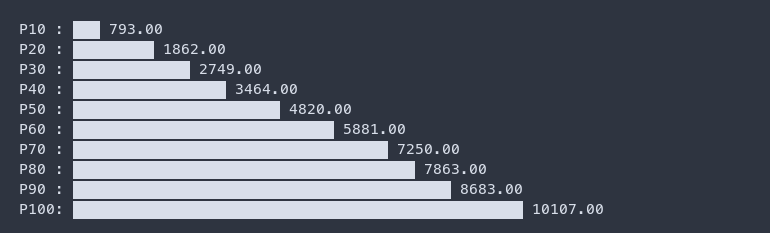
You can also increase the granularity of percentiles by increasing the list of inputs to percentile.sh
cat /tmp/content-length-distribution.txt | ./percentile.sh $(seq 1 20 | while read p; do echo "$p * 5" | bc; done) | termgraph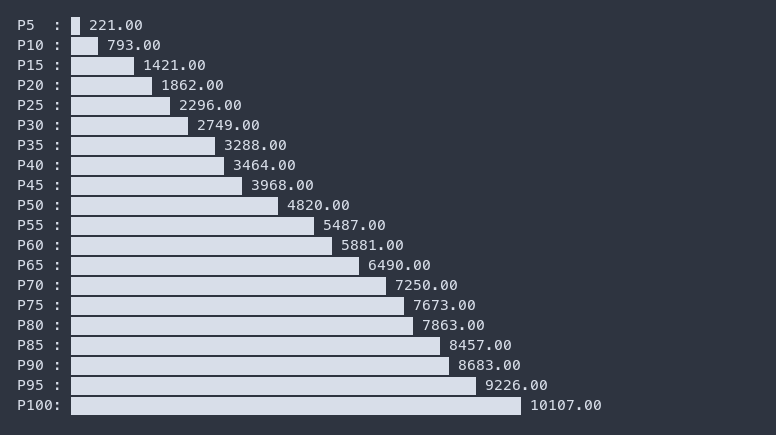
If you want to try out the above commands by generating sample data, follow these steps:
- Start a python server in terminal-1
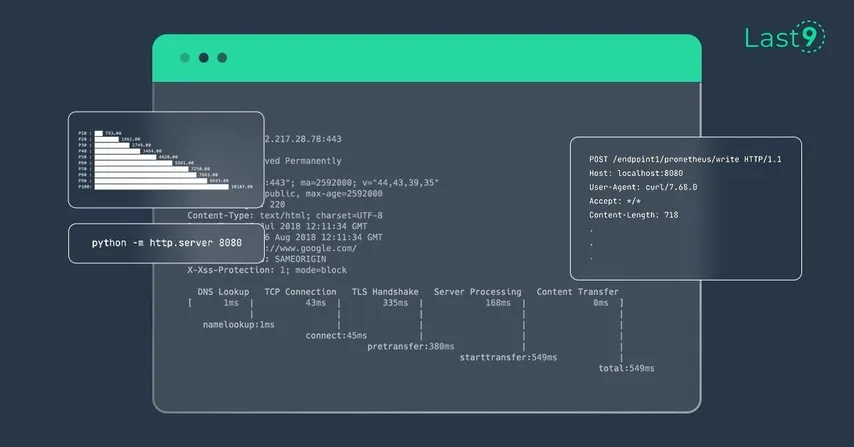
python -m http.server 80802. Send POST traffic of varying content lengths to it in terminal-2 with max content lenght capped at 1 KB:
while : ; do curl --location --request POST 'http://localhost:8080' --data-raw "$(cat /dev/urandom | tr -dc 'a-z0-9' | fold -w $(shuf -i 100-1024 -n 1) | head -1)"; sleep 0.1; done3. Analyze the traffic in terminal-3 (to be run as root)
tcpdump -A -vvv -nli any '(port 8080) and (length > 74)' -s 0 -w - 2>/dev/null | strings | grep -A10 HTTP | tee /tmp/content-lengths.txt4. Run for a minute or so to capture the data and run the above calculations.
Another interesting part is that we can use the same filters with a minor tweak to get per endpoint stats i.e.
tcpdump -A -vvv -nli any '(port 8080) and (length > 74)' -s 0 -w - 2>/dev/null | strings | grep -A10 HTTPoutput is
POST /endpoint1/prometheus/write HTTP/1.1Host: localhost:8080User-Agent: curl/7.68.0Accept: */*Content-Length: 718...Because POST /endpoint1/prometheus/write and Content-Length have 3 lines between them, I could do the following to filter the right endpoint headers:
tcpdump -A -vvv -nli any '(port 8080) and (length > 74)' -s 0 -w - 2>/dev/null | strings | grep -A10 HTTP | grep -A3 "POST /endpoint2"It’s worth mentioning that along with sed, grep, awk, we have friends like fold, shuf to help us out in times of need.
A key takeway from this exercise is that having the tooling handy to get back-of-the-napkin calculations gives good insights before instrumenting logs and metrics.
Got questions, doubts, suggestions? You can reach out to me on Twitter/Linkedin.
Oh, before i forget — Please check out Last9. We’re reimagining Site Reliability Engineering. 🟢