Nov 24th, ‘23/8 min read
Building Logs to Metrics pipelines with Vector
How to build a pipeline to convert logs to metrics and ship them to long term storage like Levitate

Converting logs to metrics is an excellent strategy for faster querying and alerting, as metrics are lightweight compared to raw logs. Additionally, metrics provide insights such as trends and patterns compared to logs to monitor systems in real-time.
This blog will introduce using Vector to convert logs to metrics and use an external long-term metric storage such as Levitate to store and query the converted metrics.
What is Vector?
Vector is a tool used to build observability pipelines. Given the versatility of this tool, it can perform various ETL operations on your observability data. This blog will focus on transforming application logs, converting them to metrics, and storing the metric data in Levitate.
Vector Topology
Vector configuration is declarative; we can describe how logs to metrics processing will work within the config file. Configuration is split into three layers and needs to be chained using named references.
Three layers are Sources, Transforms, and Sinks.
Each of these layers has different types. Different types dictate the behavior of the layer itself.
Here is how a Vector Event looks like
{
  "container_created_at": "2023-11-22T12:01:15.490027506Z",
  "container_id": "e166d320fecdd102671ea49b0392741eeca01a8b808e483471fc0a8dc86dfcf5",
  "container_name": "cron",
  "host": "26e6f6f84488",
  "image": "periodic-cronjob",
  "label": {
    "com.docker.compose.config-hash": "5d155f1d0e497b7e4b582878c183fd2224680edada25391a9cc73d9d8c038c63",
    "com.docker.compose.container-number": "1",
    "com.docker.compose.depends_on": "",
    "com.docker.compose.image": "sha256:d56035b85af9fa6cbc8c8e8db0bb5b27f2391faab98d38c668484fc270c20986",
    "com.docker.compose.oneoff": "False",
    "com.docker.compose.project": "periodic-cronjob",
    "com.docker.compose.project.config_files": "/Users/developer/workspace/distributed-system-monitoring/docker-compose.yaml",
    "com.docker.compose.project.working_dir": "/Users/developer/workspace/distributed-system-monitoring",
    "com.docker.compose.service": "cron",
    "com.docker.compose.version": "2.18.1"
  },
  "message": "[periodic_job]: SUCCESSFUL EXIT",
  "source_type": "docker_logs",
  "stream": "stdout",
  "timestamp": "2023-11-22T14:09:02.136415171Z"
}
High-Level Architecture & Setup
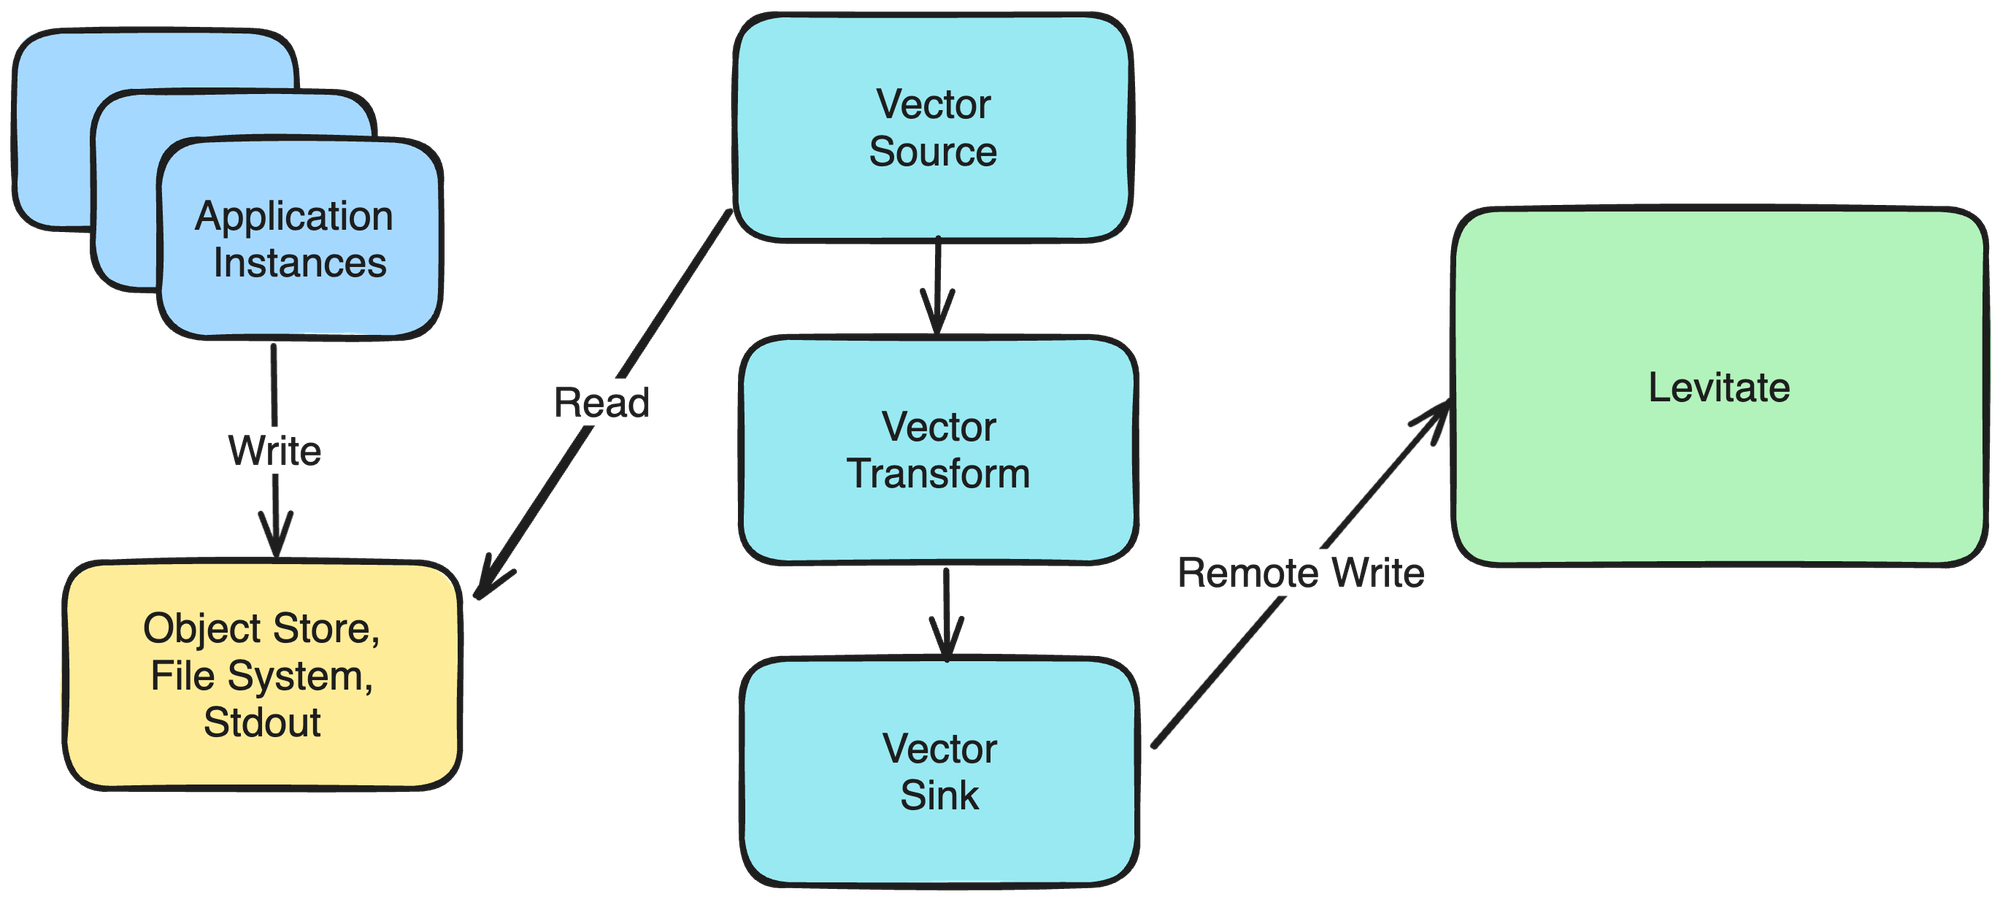
Application instances typically write logs via STDOUT to either an Object Store or a file system or emit logs to STDOUT. We have used File System as the source to read logs from in this blog.
Here is what our raw logs look like, which get stored in the File System as gzipped JSON files. These logs are sample nginx ingress logs from a Kubernetes cluster.
{
"log": "{\\"host\\": \\"storefront.acmetech.com\\", \\"remote_addr\\": \\"192.246.147.171\\", \\"remote_user\\": \\"FUlvGehwJB.host.com\\", \\"time_local\\": \\"04/Sep/2023:18:30:00 +0530\\", \\"request\\": \\"GET /v1.1/customer/get?format=json&mobile=9111111111&mlp=True&user_id=False&next_slab=True&slab_history=False®istered_store=False®istered_till=True&fraud_details=False&ndnc_status=False&optin_status=True&expiry_schedule=True&expired_points=False&points_summary=True&promotion_points=False&membership_retention_criteria=True&tier_upgrade_criteria=False&gap_to_upgrade_for=0&gap_to_renew_for=0&user_group=False&transactions=True&subscriptions=False&segments=False&delayed_accrual=True&tracker_info=False HTTP/1.1\\", \\"request_method\\": \\"GET\\", \\"request_uri\\": \\"/v1.1/customer/get?format=json&mobile=9111111111&mlp=True&user_id=False&next_slab=True&slab_history=False®istered_store=False®istered_till=True&fraud_details=False&ndnc_status=False&optin_status=True&expiry_schedule=True&expired_points=False&points_summary=True&promotion_points=False&membership_retention_criteria=True&tier_upgrade_criteria=False&gap_to_upgrade_for=0&gap_to_renew_for=0&user_group=False&transactions=True&subscriptions=False&segments=False&delayed_accrual=True&tracker_info=False\\", \\"uri\\": \\"/v1.1/customer/get?format=json&mobile=9111111111&mlp=True&user_id=False&next_slab=True&slab_history=False®istered_store=False®istered_till=True&fraud_details=False&ndnc_status=False&optin_status=True&expiry_schedule=True&expired_points=False&points_summary=True&promotion_points=False&membership_retention_criteria=True&tier_upgrade_criteria=False&gap_to_upgrade_for=0&gap_to_renew_for=0&user_group=False&transactions=True&subscriptions=False&segments=False&delayed_accrual=True&tracker_info=False\\", \\"scheme\\": \\"http\\", \\"server_protocol\\": \\"HTTP/1.1\\", \\"status\\": \\"301\\", \\"body_bytes_sent\\": \\"34\\", \\"http_referer\\": \\"-\\", \\"http_user_agent\\": \\"Java/HpdCE\\", \\"request_length\\": \\"234\\", \\"request_time\\": \\"0.047\\", \\"proxy_upstream_name\\": \\"default-storefront-api-8003\\", \\"proxy_alternative_upstream_name\\": \\"\\", \\"upstream_addr\\": \\"192.208.158.240:8003\\", \\"response_length\\": \\"15\\", \\"response_time\\": \\"0.082\\", \\"response_status\\": \\"401\\", \\"req_id\\": \\"DMYDaywLalBjsreASeWQqbiGdcVlLBmh\\", \\"org_id\\": \\"b6c98d1b-b68f-441c-89b2-44068c51a496\\", \\"till\\": \\"-\\", \\"cap_status_code\\": \\"-\\", \\"is_cache\\": \\"-\\", \\"is_async\\": \\"-\\", \\"is_bulk\\": \\"-\\", \\"uri_path\\": \\"-\\", \\"req_hit_timestamp\\": \\"1674444071.168312.119\\"}",
"stream": "stdout",
"kubernetes": {
"container_name": "nginx-ingress-controller",
"pod_name": "intouch-ingress-nginx-ingress-controller-UlsVQj",
"host": "ip-192-102-236-136.ec2.internal"
},
"key": "intouch-ingress-nginx-ingress-controller-UlsVQj",
"app_name": "nginx-ingress"
}
Vector Source Layer Config
Vector has different types of sources; one of the types is File. Below is an example config:
sources:
  nginx_logs:
    type: file
    include: # Array of file patterns to include.
      - /var/tmp/myapp/logs/*.log.gz
    file_key: file
    glob_minimum_cooldown_ms: 1000
    host_key: host
    ignore_older_secs: 600
    read_from: beginning
Vector gunzips log file and create a Vector event that looks like this. The entire log line is a JSON string attribute of "message"
{"file":"/var/tmp/myapp/logs/nginx.202311240850_0.log.gz","host":"xff6e36433ec9","message":"{\\"log\\":\\"{\\\\\\"host\\\\\\": \\\\\\"storefront.acme.com\\\\\\", \\\\\\"remote_addr\\\\\\": \\\\\\"192.240.216.150\\\\\\", \\\\\\"remote_user\\\\\\": \\\\\\"jbDpEbcKvG.host.com\\\\\\", \\\\\\"time_local\\\\\\": \\\\\\"04/Sep/2023:18:30:00 +0530\\\\\\", \\\\\\"request\\\\\\": \\\\\\"GET /v1.1/customer/get?format=json&mobile=4734548414&mlp=False&user_id=True&next_slab=True&slab_history=False®istered_store=False®istered_till=False&fraud_details=True&ndnc_status=False&optin_status=True&expiry_schedule=True&expired_points=True&points_summary=True&promotion_points=True&membership_retention_criteria=True&tier_upgrade_criteria=True&gap_to_upgrade_for=0&gap_to_renew_for=0&user_group=False&transactions=False&subscriptions=False&segments=False&delayed_accrual=False&tracker_info=True HTTP/1.1\\\\\\", \\\\\\"request_method\\\\\\": \\\\\\"GET\\\\\\", \\\\\\"request_uri\\\\\\": \\\\\\"/v1.1/customer/get?format=json&mobile=4734548414&mlp=False&user_id=True&next_slab=True&slab_history=False®istered_store=False®istered_till=False&fraud_details=True&ndnc_status=False&optin_status=True&expiry_schedule=True&expired_points=True&points_summary=True&promotion_points=True&membership_retention_criteria=True&tier_upgrade_criteria=True&gap_to_upgrade_for=0&gap_to_renew_for=0&user_group=False&transactions=False&subscriptions=False&segments=False&delayed_accrual=False&tracker_info=True\\\\\\", \\\\\\"uri\\\\\\": \\\\\\"/v1.1/customer/get?format=json&mobile=4734548414&mlp=False&user_id=True&next_slab=True&slab_history=False®istered_store=False®istered_till=False&fraud_details=True&ndnc_status=False&optin_status=True&expiry_schedule=True&expired_points=True&points_summary=True&promotion_points=True&membership_retention_criteria=True&tier_upgrade_criteria=True&gap_to_upgrade_for=0&gap_to_renew_for=0&user_group=False&transactions=False&subscriptions=False&segments=False&delayed_accrual=False&tracker_info=True\\\\\\", \\\\\\"scheme\\\\\\": \\\\\\"http\\\\\\", \\\\\\"server_protocol\\\\\\": \\\\\\"HTTP/1.1\\\\\\", \\\\\\"status\\\\\\": \\\\\\"200\\\\\\", \\\\\\"body_bytes_sent\\\\\\": \\\\\\"65\\\\\\", \\\\\\"http_referer\\\\\\": \\\\\\"-\\\\\\", \\\\\\"http_user_agent\\\\\\": \\\\\\"Java/htzrr\\\\\\", \\\\\\"request_length\\\\\\": \\\\\\"416\\\\\\", \\\\\\"request_time\\\\\\": \\\\\\"0.022\\\\\\", \\\\\\"proxy_upstream_name\\\\\\": \\\\\\"default-storefront-api-8003\\\\\\", \\\\\\"proxy_alternative_upstream_name\\\\\\": \\\\\\"\\\\\\", \\\\\\"upstream_addr\\\\\\": \\\\\\"192.146.14.236:8003\\\\\\", \\\\\\"response_length\\\\\\": \\\\\\"89\\\\\\", \\\\\\"response_time\\\\\\": \\\\\\"0.013\\\\\\", \\\\\\"response_status\\\\\\": \\\\\\"201\\\\\\", \\\\\\"req_id\\\\\\": \\\\\\"haDDjQsLeAnsNkgUPQLWpqOzLriAKqVK\\\\\\", \\\\\\"org_id\\\\\\": \\\\\\"b6c98d1b-b68f-441c-89b2-44068c51a496\\\\\\", \\\\\\"till\\\\\\": \\\\\\"-\\\\\\", \\\\\\"cap_status_code\\\\\\": \\\\\\"-\\\\\\", \\\\\\"is_cache\\\\\\": \\\\\\"-\\\\\\", \\\\\\"is_async\\\\\\": \\\\\\"-\\\\\\", \\\\\\"is_bulk\\\\\\": \\\\\\"-\\\\\\", \\\\\\"uri_path\\\\\\": \\\\\\"-\\\\\\", \\\\\\"req_hit_timestamp\\\\\\": \\\\\\"1685758060.0632484.119\\\\\\"}\\",\\"stream\\":\\"stdout\\",\\"kubernetes\\":{\\"container_name\\":\\"nginx-ingress-controller\\",\\"pod_name\\":\\"intouch-ingress-nginx-ingress-controller-HzGqZt\\",\\"host\\":\\"ip-192-225-36-71.ec2.internal\\"},\\"key\\":\\"intouch-ingress-nginx-ingress-controller-HzGqZt\\",\\"app_name\\":\\"nginx-ingress\\"}","source_type":"file","timestamp":"2023-11-24T08:50:22.097715013Z"}
Vector Transform Layer Config
Similar to Sources, Vector has multiple types of transforms available. In this example, we will be using two types of transformations.
This allows us to process all the logs sourced from the file system to parse them to a desired output. In our example, given the nginx logs in JSON format, we will parse these and extract critical attributes from the log line. Some key attributes we would need as part of the labels for the metric are path, method, app_name, response_status, org_id, etc…
Below is the transform layer config.
transforms:
  json_transform:
    type: remap
    inputs:
      - nginx_logs
		source: "./parser.vrl"
Vector provides us with VRL, i.e., Vector Remap Language. Using VRL, we can filter out the desired critical attributes from the log lines and use them to construct our metric. We have written the below VRL code for our example.
# parser.vrl
raw_log = .
application_name = raw_log.app_name
node_group = raw_log.kubernetes.host
container_name = raw_log.kubernetes.container_name
pod_name = raw_log.kubernetes.pod_name
parsed_log = parse_json!(raw_log.log, max_depth: 3)
parsed_url = parse_url!(join!(["<https://last9.io>", parsed_log.request_uri]))
. = flatten(parsed_url.query)
.path = parsed_url.path
.method = parsed_log.request_method
.app_name = application_name
.node_group = node_group
.container_name = container_name
.pod_name = pod_name
.response_status = parsed_log.response_status
.response_time = parsed_log.response_time
.org_id = parsed_log.org_id
.proxy_upstream_name = parsed_log.proxy_upstream_name
This is what the Vector event looks like after the JSON transformation. Observe how only the declared attributes of the log line have been processed, including the URL Query Params as JSON attributes.
{
  "app_name": "nginx-ingress",
  "delayed_accrual": "False",
  "expired_points": "True",
  "expiry_schedule": "True",
  "format": "json",
  "fraud_details": "False",
  "gap_to_renew_for": "0",
  "gap_to_upgrade_for": "0",
  "membership_retention_criteria": "False",
  "method": "GET",
  "mlp": "False",
  "mobile": "8623120427",
  "ndnc_status": "False",
  "next_slab": "True",
  "optin_status": "True",
  "org_id": "f4f5d0e2-920b-4e13-8a50-87f81470f927",
  "path": "/v1.1/customer/get",
  "points_summary": "True",
  "promotion_points": "False",
  "proxy_upstream_name": "default-storefront-api-8003",
  "registered_store": "True",
  "registered_till": "True",
  "response_status": "401",
  "segments": "False",
  "slab_history": "False",
  "subscriptions": "True",
  "tier_upgrade_criteria": "True",
  "tracker_info": "True",
  "transactions": "True",
  "user_group": "True",
  "user_id": "True"
}
This transformation allows us to derive metrics from the above-transformed vector event. We can create metrics in OpenMetrics format by declaring the type of metrics, such as counter, histogram, gauge, etc. The input key in the config indicates which layer to read data from; in this case, it is the json_transform layer. Below is the example config.
metric_nginx:
    type: log_to_metric
    inputs: # A list of upstream source or transform IDs.
      - json_transform
    metrics:
      - type: counter
        field: app_name # Field value needs to be a float if histogram else any label that is consistent across will do
        kind: incremental
        name: http_requests_count
        timestamp: "{{timestamp}}" # This timestamp value is obtained from the vector event and not from the source. Source timestamps can be obtained by transforming them in json_transform
        tags:
          status: "{{response_status}}"
          host: "{{host}}"
          org_id: "{{org_id}}"
          path: "{{path}}"
          proxy_upstream_name: "{{proxy_upstream_name}}"
          app_name: "{{app_name}}"
          method: "{{method}}"
This creates a vector event with the declared metric name ashttp_requests_count, metric type as a counter with a timestamp, and tags as its label sets.
{
  "name": "http_requests_count",
  "tags": {
    "app_name": "nginx-ingress",
    "gap_to_renew_for": "0",
    "method": "GET",
    "optin_status": "True",
    "org_id": "f4f5d0e2-920b-4e13-8a50-87f81470f927",
    "path": "/v1.1/customer/get",
    "proxy_upstream_name": "default-storefront-api-8003",
    "status": "201",
    "transactions": "True"
  },
  "timestamp": "2023-11-24T09:12:36.490604422Z",
  "kind": "incremental",
  "counter": {
    "value": 1
  }
}
Vector Sink Layer Config
This layer dictates the delivery destination of our transformed data. In this case, metric data in OpenMetrics format should be written to a remote TSDB, i.e., Levitate. Our preferred sink type here is Prometheus Remote Write. Below is the example config.
sinks:
	levitate:
    type: prometheus_remote_write
    inputs:
      - metric_nginx
    endpoint: >-
      <levitate_cluster_remote_write_endpoint>
    auth:
      strategy: basic
      user: <levitate_cluster_username>
      password: <levitate_cluster_password>
    healthcheck: false
You can obtain Levitate cluster username and password by following Levitate onboarding guide.
Alternative to Vector to Prometheus Remote Write
If a large amount of data is being converted into metrics, the Vector to Remote Write Flow described above may run into challenges because of the following issues.
- No support for buffering at the Vector level
- Fire and Forget nature of requests
- Data loss if remote TSDB is unavailable
The alternative here would be to opt for remote writing using an external scraper such as Prometheus Agent or Vmagent and let Vector expose the metrics on /metrics port.
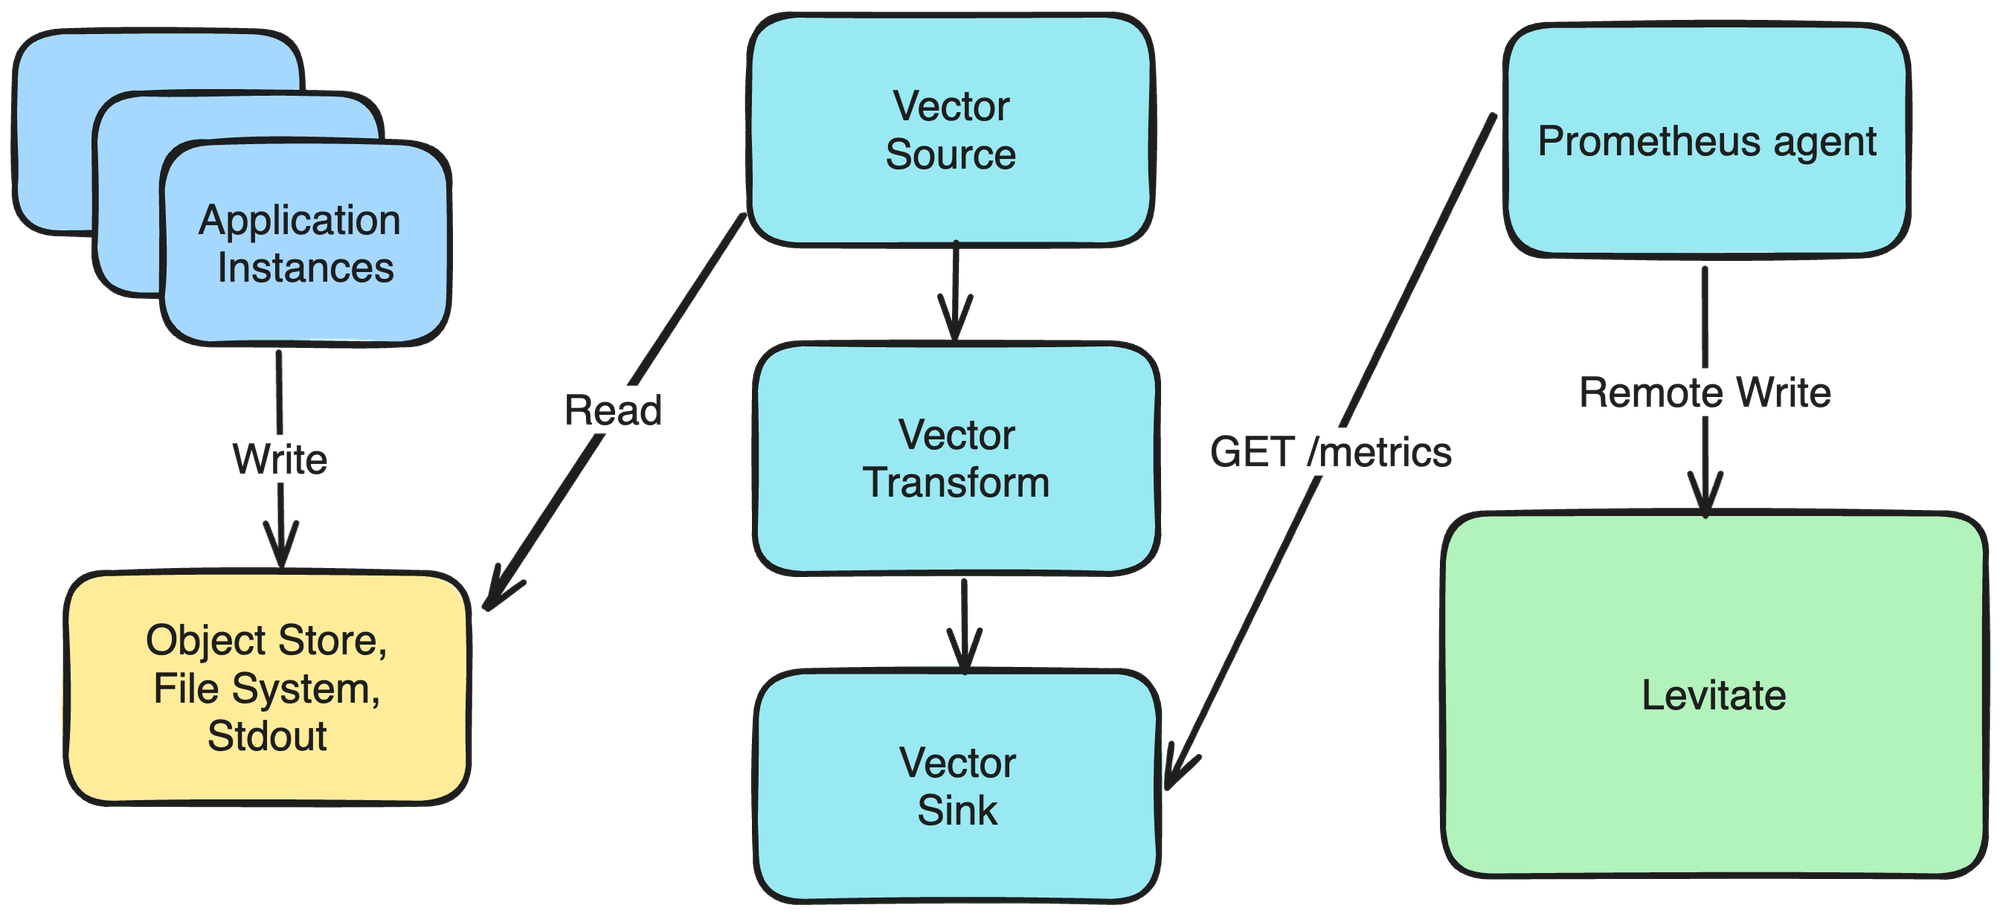
Using the sink configuration below, Vector exposes metrics on a given port. Using a scraper, we can scrape Vector as a target and then remote write it to a TSDB.
sinks:
	levitate:
    type: prometheus_exporter
    inputs:
      - metric_nginx
    address: 0.0.0.0:9598 # Port to scrape
    flush_period_secs: 60
Finally, our exposed metric data per log line looks like this.
http_requests_count{app_name="nginx-ingress",gap_to_renew_for="0",method="GET",optin_status="True",org_id="a061ba42-001f-4a77-a140-80fb0edcfcdd",path="/v1.1/customer/get",proxy_upstream_name="default-storefront-api-8003",status="500",transactions="True"} 338 1700817754613
The exposed metrics can be scraped with a Prometheus Agent and shipped to a remote storage such as Levitate.
Code Example
I have prepared a docker-compose setup that orchestrates this whole setup. Do check that out for more info.
https://github.com/anik3tra0/vector-logs2metrics-fs
In the upcoming posts, I will cover more scenarios of converting logs to metrics using Vector. Subscribe to our blog to stay updated.
Contents
Newsletter
Stay updated on the latest from Last9.
Handcrafted Related Posts
We’ve raised a $11M Series A led by Sequoia Capital India!
Change is the only constant in a cloud environment. The number of microservices is constantly growing, and each is being deployed several times a day or week, all hosted on ephemeral servers. A typical customer request depends on at least three internal and one external service. It’s a densely connected web of systems. Any change in such a connected system usually introduces a ripple. It’s tough to understand these impacts. Alert fatigue, tribal knowledge of failures, and manual correlation acro
Nishant Modak
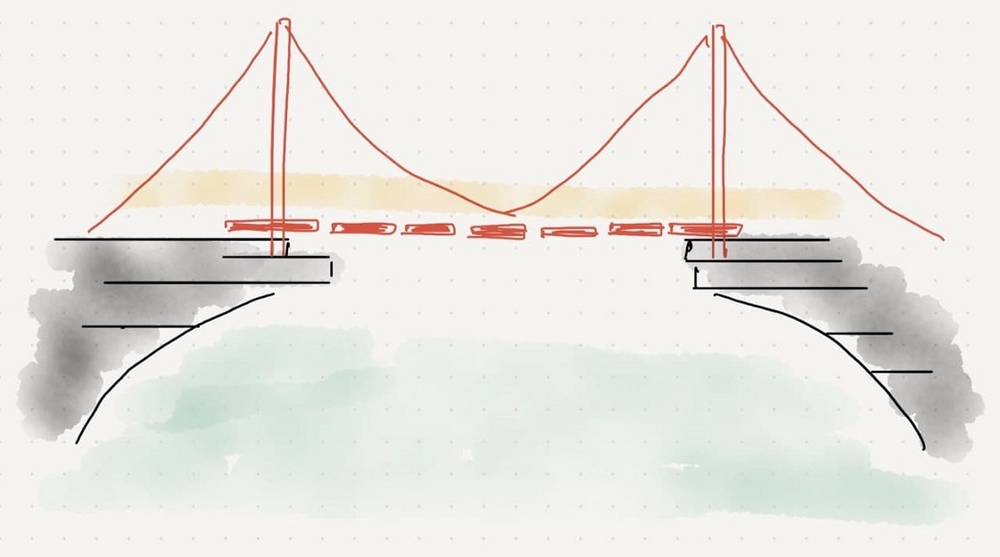
Much That We Have Gotten Wrong About SRE
An illustrated summary of Developers ➡ DevOps ➡ SRE
Piyush Verma

Running a Database on EC2 is Slowing It Down
Learn everything about the advantages of EC2, it's use cases and how to optimize EC2 further.
Jayesh Bapu Ahire, Akshay Chugh